Most options traders - from beginner to expert - are familiar with the Black-Scholes model of option pricing developed by Fisher Black and Myron Scholes in 1973. To calculate what is deemed a fair market value for any option, the model incorporates a number of variables, which include time to expiration, historical volatility and strike price. Many option traders, however, rarely assess the market value of an option before establishing a position
This has always been a curious phenomenon, because these same traders would hardly approach buying a home or a car without looking at the fair market price of these assets. This behavior seems to result from the trader's perception that an option can explode in value if the underlying makes the intended move. Unfortunately, this kind of perception overlooks the need for value analysis.
Too often, greed and haste prevent traders from making a more careful assessment. Unfortunately for many option buyers, the expected move of the underlying may already be priced into the option's value. Indeed, many traders sorely discover that when the underlying makes the anticipated move, the option's price might decline rather than increase. This mystery of options pricing can often be explained by a look at implied volatility (IV). Let's take a look at the role that IV plays in option pricing and how traders can best take advantage of it.
What Is Volatility?
An essential element determining the level of option prices, volatility is a measure of the rate and magnitude of the change of prices (up or down) of the underlying. If volatility is high, the premium on the option will be relatively high, and vice versa. Once you have a measure of statistical volatility (SV) for any underlying, you can plug the value into a standard options pricing model and calculate the fair market value of an option.
A model's fair market value, however, is often out of line with the actual market value for that same option. This is known as option mispricing. What does this all mean? To answer this question, we need to look closer at the role IV plays in the equation.
What good is a model of option pricing when an option's price often deviates from the model's price (that is, its theoretical value)? The answer can be found in the amount of expected volatility (implied volatility) the market is pricing into the option. Option models calculate IV using SV and current market prices. For instance, if the price of an option should be three points in premium price and the option price today is at four, the additional premium is attributed to IV pricing. IV is determined after plugging in current market prices of options, usually an average of the two nearest just out-of-the-money option strike prices. Let's take a look at an example using cotton call options to explain how this works.
Sell Overvalued Options, Buy Undervalued Options
Let's take a look at these concepts in action to see how they can be put to use. Fortunately, today's options software can do most all the work for us, so you don't need to be a math wizard or an Excel spreadsheet guru writing algorithms to calculate IV and SV. Using the scanning tool in OptionsVue 5 Options Analysis Software, we can set search criteria for options that are showing both high historical volatility (recent price changes that have been relatively fast and big) and high implied volatility (imarket price of options that has been greater than theoretical price).
Let's scan commodity options, which tend to have very good volatility, (this, however, can also be done with stock options) to see what we can find. This example shows the close of trading on March 8, 2002, but the principal applies to all options markets: when volatility is high, options buyers should be wary of straight options buying, and should probably be looking to sell. Low volatility, on the other hand, which generally occurs in quiet markets, will offer better prices for buyers. Figure 1 contains the results of our scan, which is based on the criteria just outlined.
Options Scan for High Current Implied and Statistical Volatility
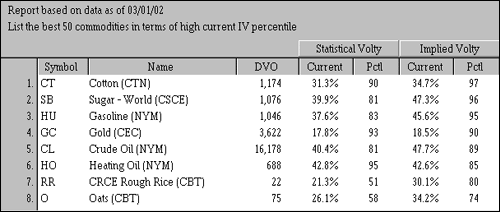
Figure 1 Source: OptionVue
Looking at our scan results, we can see that cotton tops the list. IV is 34.7% at the 97th percentile of IV (which is very high), with the past six years as a reference range. In addition, SV is 31.3%, which is at the 90th percentile of its six-year high-low range. These are overvalued options (IV > SV) and are high priced due to the extreme levels of both SV and IV (i.e. SV and IV are at or above their 90th percentile rankings). Clearly, these are not options you would want to be buying - at least not without taking into account their expensive nature.
As you can see from Figure 2, below, both IV and SV tend to revert to their normally lower levels, and can do so quite quickly. You can, therefore, have a sudden collapse of IV (and SV) and a quick fall in premiums, even without a move of cotton prices. In such a scenario, the option buyers often get fleeced.
Cotton Futures - Implied and Statistical Volatility
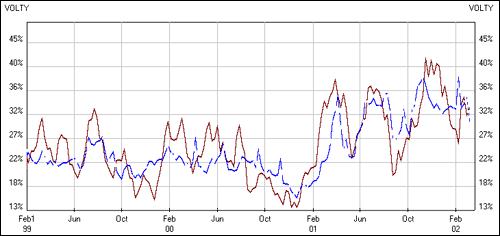
Figure 2: SV and IV revert to normally lower levels Source: OptionVue
There are, however, excellent option writing strategies that can take advantage of these high volatility levels. We will cover these strategies in future articles. In the meantime, it is a good idea to get in the habit of checking the levels of volatility (both SV and IV) before establishing any option position. It is worth investing in some good software to make the job timesaving and accurate.
In Figure 2, above, July cotton IV and SV have somewhat come off their extremes, yet they remain well above the 22% levels, around which IV and SV oscillated in 1999 and 2000. What has caused this jump in volatility? Exhibit 3 below contains a daily bar chart for cotton futures, which tells us something about the changing volatility levels shown above.
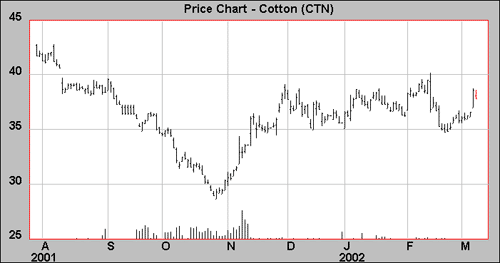
Figure 3 Source: OptionVue
The sharp bearish declines of 2001 and sudden v-shaped bottom in late October caused a spike in volatility levels, which can be seen in the breakout higher in the volatility levels of Figure 2. Remember that the rate of change and the size of changes in price will directly affect SV, and this can increase the expected volatility (IV), especially because the demand for options relative to supply increases sharply when there is an expectation of a large move.
To finish our discussion, let's take a closer look at IV by examining what is known as a volatility skew. Figure 4, below, contains a classic July cotton call options skew. The IV for calls increases as the option strikes get farther away from the money (as seen in the northeasterly, upward sloping shape of the skew, which forms a smile, or smirk shape).
This tells us that the farther away from the money the call option strike is, the greater the IV is in that particular option strike. The levels of volatility are plotted along the vertical axis.
As you can see, the deep out-of-the-money calls are extremely inflated (IV > 42%).
July Cotton Calls - Implied Volatility Skew
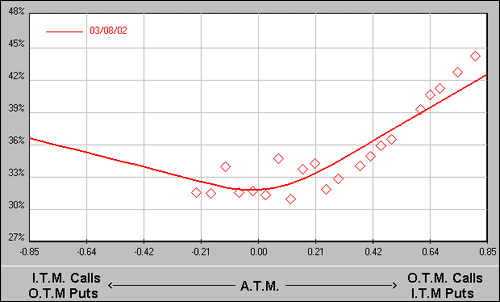
Figure 4 Source: OptionVue
The data for each of the call strikes displayed in Figure 4 is included in Figure 5, below. When we move farther away from the at-the-money call strikes for the July calls, IV increases from 31.8% (just out of the money) at the 38 strike to 42.3% for the July 60 strike (deep out of the money). In other words, the July call strikes that are farther away from the money have more IV than those nearer to the money. By selling the higher implied volatility options and buying lower implied volatility options, a trader can profit if the IV skew eventually flattens out. This can happen even with no directional moves of the underlying futures.
July Cotton Calls - IV Skew
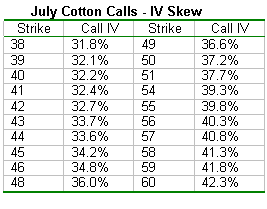
Figure 5
In Summary
Volatility is a measure of how rapid price changes have been (SV) and what the market expects the price to do (IV). When volatility is high, buyers of options should be wary of straight options buying, and they should be looking instead to sell options. Low volatility, on the other hand, which generally occurs in quiet markets, will offer better prices for buyers; however, there's no guarantee the market will make a violent move anytime soon. By incorporating into trading an awareness of IV and SV, which are important dimensions of pricing, you can gain a decisive edge as an options trader.
Dr John Summa can be contacted at OptionsNerd LLC
This has always been a curious phenomenon, because these same traders would hardly approach buying a home or a car without looking at the fair market price of these assets. This behavior seems to result from the trader's perception that an option can explode in value if the underlying makes the intended move. Unfortunately, this kind of perception overlooks the need for value analysis.
Too often, greed and haste prevent traders from making a more careful assessment. Unfortunately for many option buyers, the expected move of the underlying may already be priced into the option's value. Indeed, many traders sorely discover that when the underlying makes the anticipated move, the option's price might decline rather than increase. This mystery of options pricing can often be explained by a look at implied volatility (IV). Let's take a look at the role that IV plays in option pricing and how traders can best take advantage of it.
What Is Volatility?
An essential element determining the level of option prices, volatility is a measure of the rate and magnitude of the change of prices (up or down) of the underlying. If volatility is high, the premium on the option will be relatively high, and vice versa. Once you have a measure of statistical volatility (SV) for any underlying, you can plug the value into a standard options pricing model and calculate the fair market value of an option.
A model's fair market value, however, is often out of line with the actual market value for that same option. This is known as option mispricing. What does this all mean? To answer this question, we need to look closer at the role IV plays in the equation.
What good is a model of option pricing when an option's price often deviates from the model's price (that is, its theoretical value)? The answer can be found in the amount of expected volatility (implied volatility) the market is pricing into the option. Option models calculate IV using SV and current market prices. For instance, if the price of an option should be three points in premium price and the option price today is at four, the additional premium is attributed to IV pricing. IV is determined after plugging in current market prices of options, usually an average of the two nearest just out-of-the-money option strike prices. Let's take a look at an example using cotton call options to explain how this works.
Sell Overvalued Options, Buy Undervalued Options
Let's take a look at these concepts in action to see how they can be put to use. Fortunately, today's options software can do most all the work for us, so you don't need to be a math wizard or an Excel spreadsheet guru writing algorithms to calculate IV and SV. Using the scanning tool in OptionsVue 5 Options Analysis Software, we can set search criteria for options that are showing both high historical volatility (recent price changes that have been relatively fast and big) and high implied volatility (imarket price of options that has been greater than theoretical price).
Let's scan commodity options, which tend to have very good volatility, (this, however, can also be done with stock options) to see what we can find. This example shows the close of trading on March 8, 2002, but the principal applies to all options markets: when volatility is high, options buyers should be wary of straight options buying, and should probably be looking to sell. Low volatility, on the other hand, which generally occurs in quiet markets, will offer better prices for buyers. Figure 1 contains the results of our scan, which is based on the criteria just outlined.
Options Scan for High Current Implied and Statistical Volatility

Figure 1 Source: OptionVue
Looking at our scan results, we can see that cotton tops the list. IV is 34.7% at the 97th percentile of IV (which is very high), with the past six years as a reference range. In addition, SV is 31.3%, which is at the 90th percentile of its six-year high-low range. These are overvalued options (IV > SV) and are high priced due to the extreme levels of both SV and IV (i.e. SV and IV are at or above their 90th percentile rankings). Clearly, these are not options you would want to be buying - at least not without taking into account their expensive nature.
As you can see from Figure 2, below, both IV and SV tend to revert to their normally lower levels, and can do so quite quickly. You can, therefore, have a sudden collapse of IV (and SV) and a quick fall in premiums, even without a move of cotton prices. In such a scenario, the option buyers often get fleeced.
Cotton Futures - Implied and Statistical Volatility

Figure 2: SV and IV revert to normally lower levels Source: OptionVue
There are, however, excellent option writing strategies that can take advantage of these high volatility levels. We will cover these strategies in future articles. In the meantime, it is a good idea to get in the habit of checking the levels of volatility (both SV and IV) before establishing any option position. It is worth investing in some good software to make the job timesaving and accurate.
In Figure 2, above, July cotton IV and SV have somewhat come off their extremes, yet they remain well above the 22% levels, around which IV and SV oscillated in 1999 and 2000. What has caused this jump in volatility? Exhibit 3 below contains a daily bar chart for cotton futures, which tells us something about the changing volatility levels shown above.

Figure 3 Source: OptionVue
The sharp bearish declines of 2001 and sudden v-shaped bottom in late October caused a spike in volatility levels, which can be seen in the breakout higher in the volatility levels of Figure 2. Remember that the rate of change and the size of changes in price will directly affect SV, and this can increase the expected volatility (IV), especially because the demand for options relative to supply increases sharply when there is an expectation of a large move.
To finish our discussion, let's take a closer look at IV by examining what is known as a volatility skew. Figure 4, below, contains a classic July cotton call options skew. The IV for calls increases as the option strikes get farther away from the money (as seen in the northeasterly, upward sloping shape of the skew, which forms a smile, or smirk shape).
This tells us that the farther away from the money the call option strike is, the greater the IV is in that particular option strike. The levels of volatility are plotted along the vertical axis.
As you can see, the deep out-of-the-money calls are extremely inflated (IV > 42%).
July Cotton Calls - Implied Volatility Skew

Figure 4 Source: OptionVue
The data for each of the call strikes displayed in Figure 4 is included in Figure 5, below. When we move farther away from the at-the-money call strikes for the July calls, IV increases from 31.8% (just out of the money) at the 38 strike to 42.3% for the July 60 strike (deep out of the money). In other words, the July call strikes that are farther away from the money have more IV than those nearer to the money. By selling the higher implied volatility options and buying lower implied volatility options, a trader can profit if the IV skew eventually flattens out. This can happen even with no directional moves of the underlying futures.
July Cotton Calls - IV Skew

Figure 5
In Summary
Volatility is a measure of how rapid price changes have been (SV) and what the market expects the price to do (IV). When volatility is high, buyers of options should be wary of straight options buying, and they should be looking instead to sell options. Low volatility, on the other hand, which generally occurs in quiet markets, will offer better prices for buyers; however, there's no guarantee the market will make a violent move anytime soon. By incorporating into trading an awareness of IV and SV, which are important dimensions of pricing, you can gain a decisive edge as an options trader.
Dr John Summa can be contacted at OptionsNerd LLC
Last edited by a moderator:
