Hi Austin
I was just thinking about your question, I think this is what you wanted to know.
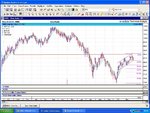
All I've done is draw a straight forward bar chart. Put what I think is major support and now resistance @ 9000 ( the red line that goes right across the chart). Drawn what looks to me to be a nice little up channel, put in 10 20 30 day MA's. Lastly I wanted to know where the fib retracement levels are if the channel gives way. To do this I clicked on my fib tab and dragged the pointer from 9000 down to the low @ just under 7250, and that's it. I hope this is of some help.
Good luck
Greg