You are using an out of date browser. It may not display this or other websites correctly.
You should upgrade or use an alternative browser.
You should upgrade or use an alternative browser.
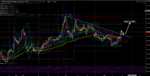
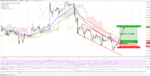
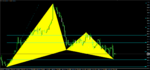
USDJPY: Anka is testing the critical support before 10
The trend is strongly bearish on all chart timeframes.
Anka is testing the Fibonacci 50% of the AB movement. And this level is an important support.
Daily closing below 110.800 will carry the price towards 110.000 and 108.600.
We will be focusing on 110.800 support.
The trend is strongly bearish on all chart timeframes.
Anka is testing the Fibonacci 50% of the AB movement. And this level is an important support.
Daily closing below 110.800 will carry the price towards 110.000 and 108.600.
We will be focusing on 110.800 support.
Attachments
EURUSD Consolidating
Fundamentals and Economic Calendar:
ECB’s officers have started to talk about EUR’s strength, with Governing Council member Ardo Hansson saying that the central bank could end QE “in one step” without any problem, adding, however, that many eurozone countries are not prepared for an interest rate reversal. This Tuesday, German’s inflation figures will take centre stage, while the US will only offer the NY Empire State manufacturing index.
EURUSD Forecast and Technicals:
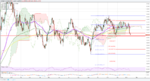
EURUSD has been consolidating in Asia session between 1.22900 and 1.22500 ahead of Germany data.
EURUSD is being priced at 1.22680 currently. On the H4 chart; the price is above all main Moving Averages. RSI value is 80.
Short term; price will continue its bullish movement as long as it holds above 1.22100. If it breaks below 1.22100, we may see a corrective move towards 1.21500 and 1.20800.
1.23200 and 1.23600 are the next targets of the EURUSD.
Pullbacks are buying opportunities. Possible pullback levels. 1.22300 and 1.22100.
Fundamentals and Economic Calendar:
ECB’s officers have started to talk about EUR’s strength, with Governing Council member Ardo Hansson saying that the central bank could end QE “in one step” without any problem, adding, however, that many eurozone countries are not prepared for an interest rate reversal. This Tuesday, German’s inflation figures will take centre stage, while the US will only offer the NY Empire State manufacturing index.
EURUSD Forecast and Technicals:
EURUSD has been consolidating in Asia session between 1.22900 and 1.22500 ahead of Germany data.
EURUSD is being priced at 1.22680 currently. On the H4 chart; the price is above all main Moving Averages. RSI value is 80.
Short term; price will continue its bullish movement as long as it holds above 1.22100. If it breaks below 1.22100, we may see a corrective move towards 1.21500 and 1.20800.
1.23200 and 1.23600 are the next targets of the EURUSD.
Pullbacks are buying opportunities. Possible pullback levels. 1.22300 and 1.22100.
Attachments
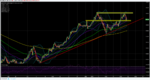
GBPUSD GBP Index indicates bullish bias
Our mid-term target was 1.38000 and we have reached our target faster than expected.
Soft Brexit: Traders reacted positively to the statement by the finance ministers of Spain and the Netherlands that they support the “soft” version of Brexit.
Today; inflation data for December will be released in the UK, which may have an effect on the dynamics of the British pound. According to preliminary forecasts, the growth of consumer prices may slow down.
We see a bullish bias on GBP Index. And DXY continues to fall.
GBPUSD Forecast And Technicals:
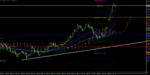
Cable is being priced at 1.37830 currently.
On the H4 chart, we can see the consolidation. If the price cannot remain above 1.38000 we can see a pullback towards 1.37320.
RSI value is 76 and it is not in the overbought area.1.36800 is the main support. And the cable will continue it’s bullish move as long as it holds above 1.36800 support.
Possible pullback levels to use as buying opportunities are 1.37300 and 1.36800.
The next target of the GBPUSD will be 1.38500 and 1.39100.
Our mid-term target was 1.38000 and we have reached our target faster than expected.
Soft Brexit: Traders reacted positively to the statement by the finance ministers of Spain and the Netherlands that they support the “soft” version of Brexit.
Today; inflation data for December will be released in the UK, which may have an effect on the dynamics of the British pound. According to preliminary forecasts, the growth of consumer prices may slow down.
We see a bullish bias on GBP Index. And DXY continues to fall.
GBPUSD Forecast And Technicals:
Cable is being priced at 1.37830 currently.
On the H4 chart, we can see the consolidation. If the price cannot remain above 1.38000 we can see a pullback towards 1.37320.
RSI value is 76 and it is not in the overbought area.1.36800 is the main support. And the cable will continue it’s bullish move as long as it holds above 1.36800 support.
Possible pullback levels to use as buying opportunities are 1.37300 and 1.36800.
The next target of the GBPUSD will be 1.38500 and 1.39100.
Attachments
The trend is strongly bearish on all chart timeframes.
Anka is testing the Fibonacci 50% of the AB movement. And this level is an important support.
Daily closing below 110.800 will carry the price towards 110.000 and 108.600.
We will be focusing on 110.800 support.
What is "Anka" please?
usdjpywhat is "anka" please?
CADCHF Channel Breakout
CADCHF Channel Break out Potential LONG Opportunity 01-17-2018
As described in the chart, CADCHF breaks out the falling channel on H1 chart.
Current Level is: 0.77440
Targets are : 0.77800 and 0.78100
Stop Loss: 0.77000
You can visit our web fxters.com for more details
CADCHF Channel Break out Potential LONG Opportunity 01-17-2018
As described in the chart, CADCHF breaks out the falling channel on H1 chart.
Current Level is: 0.77440
Targets are : 0.77800 and 0.78100
Stop Loss: 0.77000
You can visit our web fxters.com for more details
Attachments
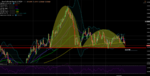
AUDJPY Potential Short Opportunity
PAIR: AUDJPY
CHART TIMEFRAME: H4
TREND ON THE CHART TIMEFRAME: NEUTRAL
FACTS AND PATTERNS: SUPPORT ZONE, EMA 50 AND TREND LINE BREAKOUT
CURRENT PRICE: 88.48
POSSIBLE “PREDICTED” PRICE ACTION: The pair formed triple top at 89.08 and pulled back. 89.30 is the support. We have a rising trend line. EMA 50 is located at 88.30. Price may test the EMA 50 and the trend line. Break out of the trend line and EMA ( possible breakout zone is 88.20 ) will carry the price 87.50 and 87.10.
ACCURACY: 92%
AUDJPY TRADE IDEA: (MIDTERM )
TRADE: SHORT
AREA OF ENTRY: 89.20-89.10
Attachments
EURGBP : 2 different formaitons on the daily chart
Positive steps on Soft Brexit and the recovery in economic data increase the expectations of a possible rate hike on GBP side.
On the euro side, things are going well for Germany, but overheating is not yet fully reflected in other countries
0.87400 – 0.87200 tested several times. Bullish trend on the bigger timeframes ended.
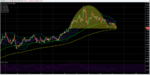
We see 2 different formations on the Daily Chart. Cup With a Handle and Descending Triangle.
0.87400 is the critical support. Bears can be more aggressive with the break out of the 0.87400 support.
The technical target of the formation is 0.82400. We need to see a daily closing below 0.87400. Our targets will be :
0.8675
0.86
0.85
0.8470 and
0.82400.
Positive steps on Soft Brexit and the recovery in economic data increase the expectations of a possible rate hike on GBP side.
On the euro side, things are going well for Germany, but overheating is not yet fully reflected in other countries
0.87400 – 0.87200 tested several times. Bullish trend on the bigger timeframes ended.
We see 2 different formations on the Daily Chart. Cup With a Handle and Descending Triangle.
0.87400 is the critical support. Bears can be more aggressive with the break out of the 0.87400 support.
The technical target of the formation is 0.82400. We need to see a daily closing below 0.87400. Our targets will be :
0.8675
0.86
0.85
0.8470 and
0.82400.
Attachments
The second Bull wave might be starting.
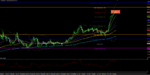
After testing 1.343, Gold pulled back towards 1.324 levels. XAUUSD is trading at 1343 currently.
Correction is completed. With the break out of 1343, 1347, 1.353 and 1.357 will be tested.
Our first big target is 1.375 and 1.400.
After testing 1.343, Gold pulled back towards 1.324 levels. XAUUSD is trading at 1343 currently.
Correction is completed. With the break out of 1343, 1347, 1.353 and 1.357 will be tested.
Our first big target is 1.375 and 1.400.
Attachments
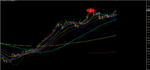
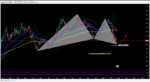
CADJPY Bullish Harmonic
CHART TIMEFRAME: H4
TREND ON THE CHART TIMEFRAME: BEARISH
FACTS AND PATTERNS: Bullish Gartley
CURRENT PRICE: 88.16
POSSIBLE “PREDICTED” PRICE ACTION: Bullish Gartley formation completed. 87.78 is the Fibonacci retracements of 88.60%. Price tested 88.84 but not touched the Fibo 88.60% at 87.78. It will test 88.33 ( Fibo 76.80% ) If it makes closing above 88.33, the targets will be 88.80 and 89.30. It may reverse from 88.40 and retest 87.78. This will be our area of entry.
ACCURACY: 98%
CADJPY TRADE IDEA: (MIDTERM )
TRADE: LONG
AREA OF ENTRY: 87.78
STOP LOSS: 87.50
TAKE PROFIT 1: 88.80
TAKE PROFIT 2: 89.30
NOTE: H4 closings below 87.78 would invalidate the setup.
If the price breaks and close above 88.33, you can try LONG with stop loss 88.10 with the same targets.
Pay attention: Your risk ( Stop Loss ) not more than 1% of your account.
Attachments
EURUSD Cup with Handle formation
Price is testing the EMA 50 support of the H4 chart.
On the smaller chart time frames, we see a cup with handle formation.
Below the current level, there is only EMA 200 support.
Breakout of 1.23300 may carry the price 1.2314, 1.2290, 1.2240 and the ultimate target of the formation 1.21600.
Few things to pay attention:
After the breakout of 1.23300, closings above 1.23800 would invalidate the formation.
The main trend is still bullish and the main support of the trend is 1.19600. We can not talk about a trend reversal as long as the price holds above 1.19600.
Attachments
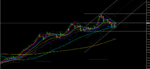
XAUUSD GOLD Forecast and Technical Analysis
Technically and fundamentally, there is nothing to push GOLD prices lower.
Today ADP and FOMC statement will be in focus. Risk of high volatility.
A hawkish FOMC statement is expected. And this may cause a temporarily bearish effect on GOLD prices as well.
However, the tren is strongly bullish.
1344 ( The current level ) is an important resistance. If it breaks out and makes H1 closings above the current level, 1347 and 1.352 will be the next intraday targets of the GOLD.
1334 is the intraday support. Closings below 1.334 will carry the price 1328 and 1324.
SHORT TERM: Price will continue its upward movement as long as it remains above 1.324. If it breaks 1324 support, 1318 and 1.312 can be tested.
MIDTERM: 1347 and 1352 are the target levels. We may see a resistance at 1352. The breakout of this resistance will carry the price 1363 and 1.369.
Attachments
Similar threads
- Replies
- 0
- Views
- 845
- Replies
- 0
- Views
- 2K
- Replies
- 0
- Views
- 6K