Taking profits too early

andyintenerife2020

Junior member
Messages
45
Likes
7
I'm swing trading, previously my open positions averaged an on screen -£13000 across 30 positions and id take £100-450 on positions however I've upped my game and increased my balance/size so now my average open positions are showing -52k (exactly 4x previous) however taking 4x profit doesn't seem worthy.
Taking a £400 profit when I have over £100k on the table doesn't seem right.
I've tried putting in trailing stops but they always get closed.
Any suggestions?
I trade major indexes and currency pairs
 
I'm swing trading, previously my open positions averaged an on screen -£13000 across 30 positions and id take £100-450 on positions however I've upped my game and increased my balance/size so now my average open positions are showing -52k (exactly 4x previous) however taking 4x profit doesn't seem worthy.
Hi Andy,
Are you saying your portfolio is showing an aggregated drawdown of -£52k? If so, I can only assume you have a seven figure plus account and/or gonads made of tungsten!
Taking a £400 profit when I have over £100k on the table doesn't seem right.
That depends on how often you're taking the £400 profit. If you're doing that once a week or, say, five times a month - then that equates to an annual return of coming up 25% - which is good.

To offer any specific suggestions, it would be helpful for you to provide your Profit Ratio, i.e. the average £’s won on winning trades relative to the average £’s lost on losing trades - along with your current methodology for taking profits.
Tim.
 
I don't do ratios
I generally don't do losing trades either.
Yes I have gonads of steel.
I used to invest and I've brought that mindset to trading, take a position and sit on it, sometimes it sits around for 20 minutes other times 2 months.
I'll take several positions in the same index or currency.
When do I take profits, generally too early, I look at the short term resistance or support and cash in.
 
Screenshot_20240104-034417.png
 
That's for the last 6 months, I have a small CFD account as well which usually has a slightly higher win rate. I only use it for hedging
 
Hi Andy,
It's a shame you don't do ratios, as that makes it difficult to know whether or not you have a positive expectancy. Traders that don't have one always - 100% of the time and without exception - lose money and stop trading and/or blow up their accounts eventually. That includes the ones that "generally" don't do losing trades. ;-)

Correct me if I'm wrong, but I assume the IG analytics only show closed trades? If all your open positions were closed, i.e. the ones that are currently £52k under water, I suspect the analytics wouldn't look quite so impressive. Be that as it may, the bar that's of interest is the losing trade sometime in December - why did you close that for circa £700 loss? I ask because your strategy appears to be that patience is rewarded and that, eventually, almost (note emphasis) everything turns around and comes back into profit? Again, if I'm correct in my assumption, then why not just set an arbitrary target of, say, 10%, 20%, 30% etc. above your current average profit? For the sake of argument, let's say your average profit per trade is £1,000. So, set a take profit target of £1,100, £1,200 - or whatever and forget it. Needless to say, what you don't want is for price to get very close to your target but fail to trigger it and then reverse back to your entry point and beyond into negative territory. So, if trailing stops aren't your thing, at least put a stop loss at break even to prevent a once profitable trade turning into a loser. The other obvious thing you could do is to use a technical analysis indicator to trigger your exit. However, I won't get into that as I seem to recall reading on another thread that you're not a fan of charts and TA - which is fair enough.
Tim.
 
I'd taken a day trade and it went completely the opposite way and quickly, felt it was better to get out.
If I closed my current positions, 28 negative and 6 positive yes the numbers would look different, I'm currently trading with profit (I don't have my own money in anymore).
Your assumptions are spot on, hence I only trade indexes and currencies "what goes down must come up" 😂 a friend of mine had 50k in usd/jpy in 1990 he managed to cash it in 4 months ago 😂 fortunately no leverage.
I don't do charts, however can you point me in the direction of a technical indicator for exiting a trade, specifically currencies
Thanks Tim
 
Yesterday I added a trailing stop 100 pips away, today the trade reversed was 35 pips away from my trailing stop so I cashed it in automatically at £345 profit, what did it do ? Down another 5 and then went back up.
 
Hi Andy,
Glad to hear you're trading with profits only - and that you can 'afford' to lose the £52k drawdown. It means your gonads only need to be made of steel rather than titanium! :cool:

I understand your frustration with stops of any kind - I feel the exact same way myself. The problem is the rogue trade that refuses to play ball and just keeps going in the wrong direction until you receive a margin call from your broker. Sooner or later, your luck will run out. No prizes for guessing how I know! Still, if you have a hedging strategy in place to deal with these rogue bad apples in the barrel - fair play to you.

Now, with regard to your specific request for a technical indicator for exiting trades, there are any number - and I mean any number - of options. Hopefully, other peeps reading your thread will chip in with their suggestions. What I'm going to propose is incredibly simple, but it will take work on your part to fine tune. Additionally, it will require you to familiarise yourself with the basics of TradingView charting software - which is free to use in the way I outline - no need for a subscription. For the purposes of my illustration, I've used a daily chart, but the principles apply equally well to other time frames.

1. Open up a (daily) chart of the instrument to be traded in TradingView.
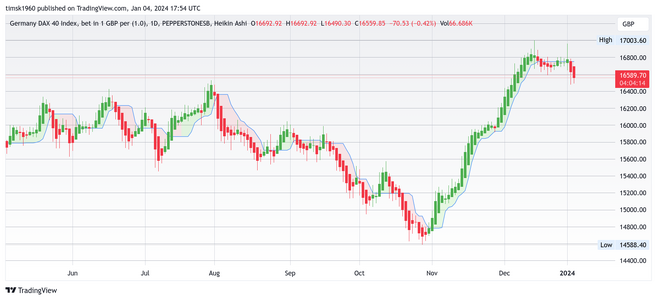
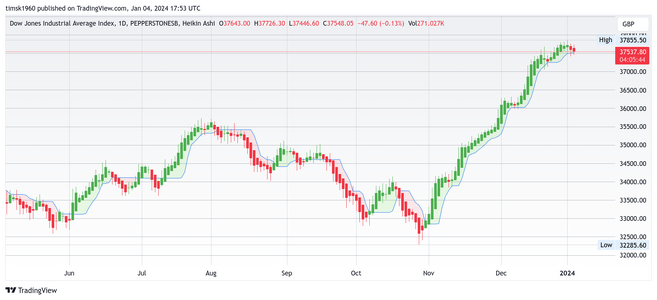
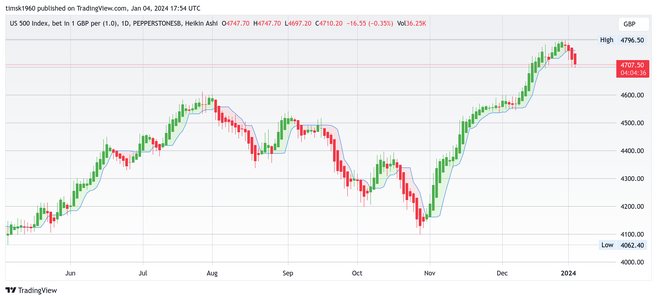
2. From the drop down menu, change the bars/candles to Heikin Ashi.
3. Under 'Indicators', search for 'Optimized Trend Tracker' (OTT). Of the options available, choose the Editor's Pick (EP) version by KivancOzbilgic.
4. Go into the indicator settings and change the 'OTT Period' to 1 and, also, the 'OTT Percent' to 1. Uncheck all the boxes under 'Inputs'. (Personally, I like the highlighter and have left that box checked - as you'll see from the attached charts, below.)

All the above sounds tedious and daunting, but trust me when I say you'll get there in a couple of hours (or less) and that if I can do it then anyone can! I'm not going to explain what Heikin Ashi candles are or what the indicator is or how it works. If you want to know, just punch them into Google (other search engines are available) and research them yourself. If you do all the above, you'll end up with charts that look - roughly / ish / mas o menos - like the ones I've attached, below.

The basic exit strategy rules could not be simpler . . .
If you're in a long trade, the candles will be green, highlighted in pale green and printing above the blue line. Exit the trade when the current candle turns red and price closes below the blue OTT line.
If you're in a short trade, the candles will be red, highlighted in pink and printing below the blue line. Exit the trade when the current candle turns green and price closes above the blue OTT line.
Don't close the trade unless and until both conditions are met. If you want to be cautious, you could close half the trade at the first red candle (in a long trade) and the other half of the position when price closes below the blue OTT line.

You can tweak the parameters of the indicator to your heart's content to find the settings that gels the best with your strategy. Needless to say, the more leeway you give the trade, then this can pay huge dividends in terms of the potential upside. The downside to this is that when price eventually turns against you and your stop is triggered, you'll have given up many, many points in profit. Also, it's a killer in range bound markets. So, here's what I suggest you do. . .

1. Of the profitable trades from your IG analytics, ignore the outliers and then work out the average profit of the 'normal' trades that represent the majority. This will give you a precise figure in £'s. This is your benchmark. I know you don't 'do' ratios, but trust me - this is important.
2. Using the chart set up outlined above and illustrated below, enter the trades as per the IG history data, and then use the simple methodology outlined above to determine where you could have exited the trade (as opposed to where you actually exited the trade). In some cases this will be before you closed the trade and in other cases after you closed the trade.
3. Do this with all trades in the historical sample and then total up the profits and compare them to the actual realised profits.
4. If the profits are less than what you achieved in reality, then the methodology is either fundamentally flawed or it needs tweaking to give trades more 'wiggle room'. This means changing the setting on the OTT indicator such that there are fewer closes above/below the blue line (which will be further away from price action).
5. With the new indicator settings, repeat the process - and again if necessary - until a better outcome is achieved.
6 This is called curve fitting and is problematic because it's based on the past and does not take account of the future and the fact that the markets are constantly changing in order to shake you off - much like a bronco shakes off a rodeo cowboy. So, before getting too excited at the potential profits - forward testing is required.
7. Assuming you arrive at a point where you can observe (to your complete satisfaction) that this methodology produces better profits on historical data than the one you're currently using then, as I say, the next step is to forward test it. Ideally, this would be done paper trading, i.e. not using your live account, in case there is some major glitch not apparent in the back testing.
8. If the forward paper trading goes well after a few months (or X number of trades), implement it using your live account using small stakes to start with until the methodology is proving to work consistently well over time.

I think that's all for the time being and gives you ample food for thought. Let me know if anything is unclear and requires further explanation. Hopefully, the charts attached below of the Dax, Dow and S&P will pique your interest sufficiently to give this a go. If not - no worries. As I say, others may have much better suggestions.
Tim.
 

Attachments

  • GER40_2024-01-04_17-54-45.png
    GER40_2024-01-04_17-54-45.png
    199.8 KB · Views: 8
  • US30_2024-01-04_17-53-15.png
    US30_2024-01-04_17-53-15.png
    193.3 KB · Views: 8
  • US500_2024-01-04_17-54-22.png
    US500_2024-01-04_17-54-22.png
    187.6 KB · Views: 7
Last edited:
Andy,
PS to yesterday's post. . .
Attached below is a chart of the Nas100 showing three OTT lines to illustrate the effect of very slightly changing the settings. The blue line has the 'OTT Percent' set at 1, the ochre line has the 'OTT Percent' set at 2 and the black line has the 'OTT Percent' set at 3.

Note that had you been in a long trade from early November, both the blue and ochre lines would have signaled an exit in early December. However, the black line would not have signaled an exit and you could have continued to ride the trend right up to the start of this week. The point being, that it's difficult (impossible) to know if a pause in a trend signals a mere pullback or will develop into a full blown reversal. For the former, a wider 'OTT Percent' line set at 3 is ideal and for the latter a shorter 'OTT Percent' line set at 1 is required. This is why backtesting the different parameters on your old trades is important, as it's one of the few ways (only way?) of working out which setting is best for your circumstances and markets.
Tim.

OTT_x3.png
 
I've got it now, is the top blue line relevant?
Hi Andy,
Well done sir!
(y)

Actually, the top blue line is the one you want. The one that's tight to price action is the 'Support Line' which you don't want. When I say "don't want" - I mean if you're wanting to replicate the charts I've posted. If you want to do that, you need to do the following . . .

1. Go into the indicator settings by clicking on the cog wheel - or whatever it's called.
2. There, you'll be given three tabs to open: 'Inputs', 'Style' and 'Visibility'. (This applies to all indicators on the platform.)
3. Open up the first one: 'Inputs', and set the source to close, the OTT Period to 1 and the OTT Percent to 1, 2 or 3 etc. depending on how much 'wiggle room' you require. (The 'Style' tab is purely for selecting colours, line thickness and so on. No idea what 'Visibility' is all about - I never touch it!)
4. Uncheck all the boxes offering different options - with the possible exception of the last one: Highlighter On/Off? Doing this will remove the 'Support Line' which is effectively just a moving average. The 'normal' way to use this indicator is to enter/exit trades when the Support Line crosses the OTT Line - which might be worth playing with - but that adds another element into the equation which may muddy the waters. So, for now at least, I recommend the 'less is more' philosophy.

Once done - your chart ought to look pretty much like mine.
Enjoy Reyes - the Spanish really know how to celebrate their festivals - no one does it better, IMO.
Tim.
 
Andy,
One little tip . . .

You can take a screenshot of your chart within TradingView itself - just click on the camera icon (circled red in the attached image, below) and then name and save the file.
Tim.

P.S. I've just had another look at your chart Andy and it looks like you're on a 1 minute time frame. That would explain why it looks the way it does and very different to mine. If you want to go down that low, then you'll need to adjust the the OTT Period to 0.1, 0.2 and 0.3 etc. etc

TradingView_Screenshot.png
 
Last edited:
Top