You are using an out of date browser. It may not display this or other websites correctly.
You should upgrade or use an alternative browser.
You should upgrade or use an alternative browser.
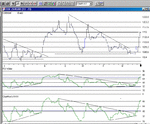
They (can) go "hand in hand" with TA "triangle/flag" breakouts to the upside (or downside...)on the price.
Velocity is the measure of rate of change of prices. A triangle formation shows a smaller and smaller " difference of opinion" on the price, eventually leading to a price breakout as one side wins and takes control.
Velocity is the measure of rate of change of prices. A triangle formation shows a smaller and smaller " difference of opinion" on the price, eventually leading to a price breakout as one side wins and takes control.
Chartman, my most sincere congratulations to you for spotting this. i have emailed to Unle the link to my article on COB.
I have just added the volume component to it, which is promising.
On fundamentals COB is trading at one of its historic lows in terms of P/E ratio AND, it has a solid record of growing earnings behind itself.
I am going to read some broker reports and post later...this looks very promising!
I have just added the volume component to it, which is promising.
On fundamentals COB is trading at one of its historic lows in terms of P/E ratio AND, it has a solid record of growing earnings behind itself.
I am going to read some broker reports and post later...this looks very promising!
Thanks Chartman for the chart and its interpretation , and Charty for further comments on COB...
I`ve been watching cob for a while...just adding a few fundementals: annual pre-tax profits jumped from £69.7m to £89m as dividends were 20.2p up from 17.55p...recent pressure on the price was due to slowdown in military orders...it was offset by growth in civil aircraft work however...
This one is worth watching...
Riz
Correct...Most brokers found results above their expectations..all of them see COB as good defensive play (however, if the tech stocks come back..then COB may be dumped for sexier stocks)..MOST borkers see current valuations reflecting fair value..Morgan Stanley wrote "..we think COB currently trades at fair value, however it potentially offers a calm harbour in the current equity storm"..they retain their hold recommendation with DCF valuation of 1,080p..Deutsche commented "Although the shares' hefty sector premium is fully deserved it leaves little room for significant near-term upside, hence we retainour Market Perform". Schroder Salomon Smith Barney have an outperform medium reisk with a target of 1,100p..it is a hold for HSBC too, although they set a target of 1,200p..finally Credit Suisse continue to rate the shares a buy..with a target price of 1,200p (!).
We can now sit down and relax and see in a couple of weeks if Charman did better in the short term than most of the broker houses!
We can now sit down and relax and see in a couple of weeks if Charman did better in the short term than most of the broker houses!
COB Update
Since my TA on COB, it has performed to expectation -Miracle! The rise has been 10% so far for 6 trading days.
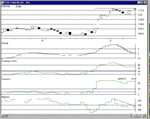
The expanded chart shows the breakout, closing today at 1150.( right on a resistance line!)
Notice My indicator (ChartMan's XXXX), which is a modified version of RSI Wilder. It is more sensitive to positive divergence than the RSI, but retains the same confirmation slope as the RSI.It's not easy to see, but the values for yesterday and today for each are:-
CMX 80.83 83.31
RSI 71.69 71.69
My indicator is showing continued uptrend,whilst RSI stayed static.
If this continues to TA rules, we should see a continued rise to 1250( following a small retracement), followed by a 50% retracement to 1150(50% of the full range of the rise!), and then onto a final target of 1350.
Please bear in mind this is a TA excercise and in the current climate, disaster could ensue.....
I'll follow it up in a week or so......
Attachments
- Messages
- 2,325
- Likes
- 17
Wow - look at the number of kisses on Chartman's proprietary indicators - that must mean he likes it a lot! 😱)
Have seen the top for this cycle on COB? There is a minor negative divergence on RSI on 14 days. Macd also does not look too bullish to me, although money flow remains positive. Stochastics are in the overbought area, thus indicating limited upside. A hold? No financial advice intended.
Similar threads
- Replies
- 0
- Views
- 15K


