bbmac
Veteren member
- Messages
- 3,584
- Likes
- 789
Hi
I don't post on boards often these days but just wanted to draw attention to this excellent thread over at forex-tsd board, if thats ok.
http://www.forex-tsd.com/general-discussion/8003-how-use-support-resistance-effectively.html
It's an excellent thread on support/resistance and price action by a guy with the username of ' Bubbles'
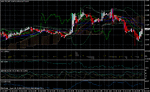
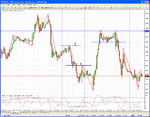
Support/Resistance and the phenomenon of Support becomes resistance (sbr) and Resistance becomes Support (rbs) are, along with price action arguably the single most important aspects of technical analysis. Your indicators merely give you a recognisable/repeatable pattern to fune tune the entry. Once you know where potential support/resistance/sbr/rbs is in any market, you can then look for high probability trading opportunities.
I have a successfull trading system/methodology that I am now prepared to give to any interested parties FREE GRATIS, ie no payment whatsoever, ...ever, lol. No catches, no hidden catches , ...I do not want anything in return, I have everything I need thank you.
Why am I giving it away? Because I feel like doing something nice, and in the long run I would like to have a chat room to 'hang out in' during my trading day where enthused, competent and serious traders can meet and share trading ideas/thoughts about the market etc free from silliness and ego that afflicts so many chat rooms, so that trading is a less isolating occupation. In recent times I have struggled to find a decent chat room, as they all seem to be good at first and then die off. If after looking at/using my trading system/methodology you wish to get a forex chat room going, whether or not you choose to use this particular system/methodology as your 'edge' in the market, please email and if there is sufficient a number of us, lets give it a go...I'll even stand the cost of any chat software we use. I just thought I'd have one last go at getting a decent chat room together for the mutual benefit of those that join, that is productive and enjoyable to visit, sharing ideas and commentary on the prevailing technical and fundamental conditions that are affecting the markets, and where no one person dominates. If it doesn't happen, so be it.
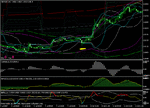
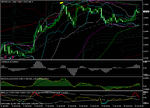
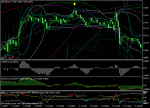
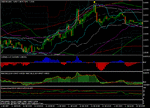
My trading system or more accurately described...methodology ...accurately identifies support/resistance/sbr/rbs in the market then identifies both with trend and against trend entries to the market via easily recognisable tech indicator set-ups centering around oscillator extremes/divergence and band/channel deviation, confirmed by price action itself.
The system/methodology utilises the triple screen approach favoured by Alexander Elder and although I choose to utilise it on the lower time frames to capture scalp/small intraday moves it can be used on any sensible combination of time frames such as 1hr (trigger), 4hr (intermediate) and Daily (longer time frame) for example, for longer 'position' trades. Effectively the system/methodology identifies high probability reversal and With trend trading opportunities.
What I should also tell you is that any trading system or methodology that you get from any third party, should really become a template for you to take the bits that you want and develop your own 'trading edge' that suits your particular tolerances/preferences/style that will be unique to you. My system/methodology will teach you the essentials of technical trading, ie support/resistance, trend, and price action, and then show you how to use technical indicators to fine tune your entry.
I should also tell you that although the system/methodology identifies high probability trading opportunities, ie the 'trading edge,' ...remember, as Mark Douglas (Trading in the Zone, The Disciplined Trader etc...) correctly states ,...the trading edge is the simple part, ...Psychology is 80%+ of trading, and I fully concur with this.
As a trader of some longevity my trading system/methodology doesn't ever let me down, but I have let it down. There have been times when I didn't take a signal or came out of a trade too early, or bottled out at smaller volume traded than I should have done etc etc....In other words I had not mastered the psychological aspects at play in my own trading.
In the perfect world, a trading edge should be executed with impunity,...when your trading edge sets-up, you should trade it, no if's but's or maybe's, None of us knows what will happen once we have entered the market. Trading is simply about probabilities, ......All we know is that we have a trading edge (s) that over a historical sample of set-ups produced an overall net gain, so that when it next sets-up we know that there is a greater probability of something happening than another. The Distribution of winning and losing set-ups of a trading edge over any given sample is not known to us in advance, how can it be, so all we can do is execute a market entry when we identify our trading edge and leave the rest to the laws of probability.
Mastering the psychology at play as a trader is the most difficult task we face, and in this respect, I am always learning. There have been times for me when Fear or Greed has taken hold, to say nothing of their cousins, Hope and Revenge....and exacted their damaging effects, meanwhile the trading edge continues to present itself, willing me to treat it correctly, lol.
My preferred charting is MT4 and my prefferred pairing is gbpusd, although any liquid instrument could be traded with this trading system/methodology.
Should you wish to have a look at my way of trading, please email me via this website, I have emails enabled. I will not pass your email on to anyone else and you will never get any email or other communication from me asking you to buy anything.
I am happy to send you my chart templates, indicators and chart profiles, as well as examples and instructions on how to quickly recognise the trading set-ups, how to identify support/resistance/sbr/rbs in your chosen market as well as how to identify trend on each time frame...when to trade and when not to trade, money and risk management parametres, and stop placement and trade managemnet techniques used by me. All fairly self explanatory really.
Please be aware though, that you will inevitably trade this system/methodology differently to me as your tolerances/preferences/style are likely to be different than mine, and as I am busy trading for a few hours most days, I am unable to mentor anyone over and above providing the system/methodology and the general discussion that goes on in a chat room, shoud there be sufficient interest to get one going.
I have no idea how many people may resquest the trading system/methodology so please bear with me. In any event, I will not be trading for about a week or so from today so will action any requests after that.
If any one has any webspace that I can upload the system/methodology to, please let me know, this may be easier so that I can post the link on it and people can download it for themselves.
bbmac.
I don't post on boards often these days but just wanted to draw attention to this excellent thread over at forex-tsd board, if thats ok.
http://www.forex-tsd.com/general-discussion/8003-how-use-support-resistance-effectively.html
It's an excellent thread on support/resistance and price action by a guy with the username of ' Bubbles'
Support/Resistance and the phenomenon of Support becomes resistance (sbr) and Resistance becomes Support (rbs) are, along with price action arguably the single most important aspects of technical analysis. Your indicators merely give you a recognisable/repeatable pattern to fune tune the entry. Once you know where potential support/resistance/sbr/rbs is in any market, you can then look for high probability trading opportunities.
I have a successfull trading system/methodology that I am now prepared to give to any interested parties FREE GRATIS, ie no payment whatsoever, ...ever, lol. No catches, no hidden catches , ...I do not want anything in return, I have everything I need thank you.
Why am I giving it away? Because I feel like doing something nice, and in the long run I would like to have a chat room to 'hang out in' during my trading day where enthused, competent and serious traders can meet and share trading ideas/thoughts about the market etc free from silliness and ego that afflicts so many chat rooms, so that trading is a less isolating occupation. In recent times I have struggled to find a decent chat room, as they all seem to be good at first and then die off. If after looking at/using my trading system/methodology you wish to get a forex chat room going, whether or not you choose to use this particular system/methodology as your 'edge' in the market, please email and if there is sufficient a number of us, lets give it a go...I'll even stand the cost of any chat software we use. I just thought I'd have one last go at getting a decent chat room together for the mutual benefit of those that join, that is productive and enjoyable to visit, sharing ideas and commentary on the prevailing technical and fundamental conditions that are affecting the markets, and where no one person dominates. If it doesn't happen, so be it.
My trading system or more accurately described...methodology ...accurately identifies support/resistance/sbr/rbs in the market then identifies both with trend and against trend entries to the market via easily recognisable tech indicator set-ups centering around oscillator extremes/divergence and band/channel deviation, confirmed by price action itself.
The system/methodology utilises the triple screen approach favoured by Alexander Elder and although I choose to utilise it on the lower time frames to capture scalp/small intraday moves it can be used on any sensible combination of time frames such as 1hr (trigger), 4hr (intermediate) and Daily (longer time frame) for example, for longer 'position' trades. Effectively the system/methodology identifies high probability reversal and With trend trading opportunities.
What I should also tell you is that any trading system or methodology that you get from any third party, should really become a template for you to take the bits that you want and develop your own 'trading edge' that suits your particular tolerances/preferences/style that will be unique to you. My system/methodology will teach you the essentials of technical trading, ie support/resistance, trend, and price action, and then show you how to use technical indicators to fine tune your entry.
I should also tell you that although the system/methodology identifies high probability trading opportunities, ie the 'trading edge,' ...remember, as Mark Douglas (Trading in the Zone, The Disciplined Trader etc...) correctly states ,...the trading edge is the simple part, ...Psychology is 80%+ of trading, and I fully concur with this.
As a trader of some longevity my trading system/methodology doesn't ever let me down, but I have let it down. There have been times when I didn't take a signal or came out of a trade too early, or bottled out at smaller volume traded than I should have done etc etc....In other words I had not mastered the psychological aspects at play in my own trading.
In the perfect world, a trading edge should be executed with impunity,...when your trading edge sets-up, you should trade it, no if's but's or maybe's, None of us knows what will happen once we have entered the market. Trading is simply about probabilities, ......All we know is that we have a trading edge (s) that over a historical sample of set-ups produced an overall net gain, so that when it next sets-up we know that there is a greater probability of something happening than another. The Distribution of winning and losing set-ups of a trading edge over any given sample is not known to us in advance, how can it be, so all we can do is execute a market entry when we identify our trading edge and leave the rest to the laws of probability.
Mastering the psychology at play as a trader is the most difficult task we face, and in this respect, I am always learning. There have been times for me when Fear or Greed has taken hold, to say nothing of their cousins, Hope and Revenge....and exacted their damaging effects, meanwhile the trading edge continues to present itself, willing me to treat it correctly, lol.
My preferred charting is MT4 and my prefferred pairing is gbpusd, although any liquid instrument could be traded with this trading system/methodology.
Should you wish to have a look at my way of trading, please email me via this website, I have emails enabled. I will not pass your email on to anyone else and you will never get any email or other communication from me asking you to buy anything.
I am happy to send you my chart templates, indicators and chart profiles, as well as examples and instructions on how to quickly recognise the trading set-ups, how to identify support/resistance/sbr/rbs in your chosen market as well as how to identify trend on each time frame...when to trade and when not to trade, money and risk management parametres, and stop placement and trade managemnet techniques used by me. All fairly self explanatory really.
Please be aware though, that you will inevitably trade this system/methodology differently to me as your tolerances/preferences/style are likely to be different than mine, and as I am busy trading for a few hours most days, I am unable to mentor anyone over and above providing the system/methodology and the general discussion that goes on in a chat room, shoud there be sufficient interest to get one going.
I have no idea how many people may resquest the trading system/methodology so please bear with me. In any event, I will not be trading for about a week or so from today so will action any requests after that.
If any one has any webspace that I can upload the system/methodology to, please let me know, this may be easier so that I can post the link on it and people can download it for themselves.
bbmac.