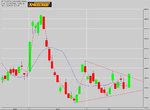
Symmetrical triangle

Atlantic Trader

Junior member
Messages
13
Likes
0
I have been watching this triangle develop in the Dec, cocoa contract . I was expecting it to break to the downside as the triangle is in a downtrend. But low and behold it has moved up through the trend line.

Any opinions out there as to why?

I had one thought that the price action was too close to the apex.

Iam not sure yet as to the volume of the move until after the open tomorrow?

Any ideas or opinions?
 

Attachments

  • dec cocoa  symetrical triangle in a downtrend.jpg
    dec cocoa symetrical triangle in a downtrend.jpg
    76.5 KB · Views: 476
Hi

Symmetrical triangles by their nature represent equal buying and selling pressure.Either camp can win this argument.

However, this triangle break is not complete. The trader needs to be aware of getting caught here in a false break out. For me this break North would need to re-trace but stay outside the original break out point, then resume its Northerly path. Others may just choose to trade the break itself.

Any return of price within the original boundaries can be seen as a fake and on many occasions , a fake break produces an even better trade to the downside, as "failed patterns" can be better trading signals than the original break.

C V
 
CV:
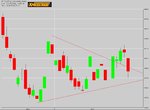
I fully expect some kind of pull back since the price action didn't move outside the triangles upper trend line. With overhead resistance nearby there will most likely be a bounce and maybe a downward move deep into the triangle?

Thanks for your point of view.
 
As a follow up the price action has brought the close back into the triangle, selling pressure has put a cap on the breakout. Was it a false breakout?

Or is this more of a continuation due to the lenght of time in consolidation as we are in fact getting closer to the apex of the triangle?

Any thought out there?
 

Attachments

  • Dec cocoa.jpg
    Dec cocoa.jpg
    67.5 KB · Views: 350
I think I will stand aside for now and wait to see if the bottom support line holds?

Any ideas opinions or strategies any one wants to share?
 
Atlantic Trader said:
I have been watching this triangle develop in the Dec, cocoa contract . I was expecting it to break to the downside as the triangle is in a downtrend. But low and behold it has moved up through the trend line.

Any opinions out there as to why?

As you can now see in retrospect, your prediction did come to pass---eventually. Cocoa broke to the upside but then did retrace and sell off through mid Novemeber, only to resume an uptrend through the present. Which proves an unfortunate point for me at least. TA is a load of ********---as much as we'd like it to not be and at best, it only shows success 50% of time (which is equal to a coin throw).

The human brain has a remarkable capacity for extracting patterns from randomness. You know, we can all see some sort of animal shape in the clouds if we're really looking for one. What obscures this issue with trading is that, when a so-called "pattern" is proven correct, it reinforces our belief in TA but when it doesn't (which is half the time), we then scratch our heads and wonder what the hell went wrong.

There has to be a better way. Probably, regression and volatility analysis is the answer.
 
counter_violent said:
For me this break North would need to re-trace but stay outside the original break out point, then resume its Northerly path.
Any return of price within the original boundaries can be seen as a fake and on many occasions , a fake break produces an even better trade to the downside, as "failed patterns" can be better trading signals than the original break.

C V
as indeed was quite clearly the case here
 
Top