Swing Trading U.S. Stocks

timsk

Legendary member
Messages
8,729
Likes
3,425
There are some active threads which discuss swing and position trading. Generally speaking though, their emphasis is on the U.K. market . Conversely, traders who focus on the U.S. market tend to be day traders, for whom there are also active threads. This thread is for those people who specifically want to discuss swing trading U.S shares. (Perhaps I'm the only one interested in this, in which case this thread will just be a monologue!)

For the purposes of the thread, by 'Swing Trading' I mean anyone who holds a position overnight. Overnight risk is the key reason why intra day traders do what they do. This risk is much greater in the U.S. market because stocks are prone to gap much more than they do in the U.K. market. So, to see if there's any interest in this thread, a good starting point might be to discuss the various ways traders' try to minimise this risk and sleep soundly at night?

Tim.
 
Des44 posted quite a lot of videos earlier this year on this theme, which were of great interest. He's gone quiet recently though. Shame cos his style of posting brought some life to these boards (rather than just the plain written word).

Maybe this thread might rouse him!
 
Hi Guys,

I'm not trading the us market at the moment, but I am studying it with great interest. I'm making my plan and finding where to get the information, and researching on the different data providers. Once I'm done with that I'm planning to start a trial period. I'll be following this thread with interest! By the way Tim, you talk in your post about gaps and reaction to news in us markets. In UK I use mainly two websites to check the important dates, not only the release of interims and annuals but also the date of AGMs (many profit warnings happen there), and trading statements. I haven't found a similar compilation of information for us yet. I did find useful data in fool.com and yahoo.com, but if you know of some useful website please send the link.
My first impression about the us is that it seems to be a more trending market. I feel the UK market as more conservative and going sideways more often than in a trend. What are your views?
Ok, I hope you get lot of people posting here. Swing trading it's great.

Good trading,

Silvia.
 
The subscription site www.briefing.com seems to be the most popular news/ company info site among serious independent traders in US stocks. Platinum service gives a live news/results feed. I think the cheaper subscriptions will give ability to search on this mornings and last nights earnings surprises etc. before the market opens.

Gareth
 
silviaic said:
Hi Guys,
Tim, you talk in your post about gaps and reaction to news in us markets. In UK I use mainly two websites to check the important dates, not only the release of interims and annuals but also the date of AGMs (many profit warnings happen there), and trading statements. I haven't found a similar compilation of information for us yet. I did find useful data in fool.com and yahoo.com, but if you know of some useful website please send the link.
Silvia.
Hi Silvia,
As garethb says, briefing.com is the bees knees if you want to subscribe, buy these two will give you most of the basics for free:

http://www.fulldisclosure.com/earning.asp?
http://uk.us.biz.yahoo.com/research/earncal/20050411.html

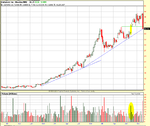
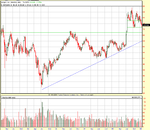
For a few weeks now, I've posted some weekly charts on the U.S. Day Traders thread and felt that they didn't sit too comfortably in that context. So, I propose to post said charts on this thread instead. ADSK caught the attention of day traders last week, but it is also of potential interest to those wanting to trade a longer term time frame - I think! The weekly chart is attached and these are my thoughts about it . . .

The obvious benefit to a longer time frame is that the information it offers cuts out noise. The disadvantage is that potentially, it also cuts out useful, salient detail that traders need to know, regardless of their time frame and trading style. ADSK is, possibly, (feel free to disagree) a case in point. Last week's huge bear candle masks the fact that most of the down move happened on Friday following a substantial gap down. Similarly, the earlier bull candle (highlighted in the yellow oval) masks a large gap up. That said, does the basic picture change? All the traders who bought through August (on large volume, also highlighted in a yellow oval) will be on the anxious side of very anxious next week, nervously watching to see what happens. Interestingly, the price has fallen back to the long term trend line shown in bloo. However, this is NOT the support line. That is indicated by the lateral green lines at $39 and $40 respectively. That the $39 support line coincides with the trend line is just that; coincidence. Certainly, if the price drops substantially below the $39 level, this is an ominous sign for the bulls and an early indication that the long term trend may - and I stress may - be about to change. For their part, the bulls will want to see a strong rally next week, re-establishing support at $39 and putting significant upward pressure on $40.
Tim.
 

Attachments

  • ADSK_18.11.05.PNG
    ADSK_18.11.05.PNG
    45.2 KB · Views: 629
Last edited:
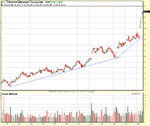
Another 'Hanging Man'

On the theme of 'hanging man' candlestick patterns; here's another one - the weekly chart for CHRW. It suggests that the stock may be running out of puff and, at the very least, wanting to take a rest and do some horizontal work. Aggressive traders will be watching for a retracement which could prompt a sizeable downside move.
Tim.
 

Attachments

  • CHRW_18.11.05.PNG
    CHRW_18.11.05.PNG
    43.6 KB · Views: 2,862
Hi all.
I live in Australia, and following a training course here decidied to trade US for its greater number of companies and higher volatility.
With a very limited bank balance I am looking for stocks up to say $10.
I am currently looking at rollingstocks100.com as a good source of rollers. So far about 50/50 profit/loss.
I am very keen to follow and get involved with this forum.

Chris
 
US swing trading

Hello everyone

Great idea for a thread Tim. I'm looking forward to reading and contributing. Thanks for your charts Tim.

Regarding the approach to take - Yes gaps can happen, but as has already been said there are some great sources of information such as briefing.com - that clears some of the minefield.

The other aspect that I think is important for avoiding the mines is market timing - i.e. using the wider markets to gauge market sentiment - if the markets look over bought (as they do now) - you can minimise your risks by being cautious in your market entries.

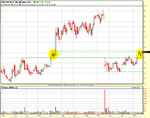
In the same vein If there are some warning bells out there (when are there not :p ) I find it best to shrink your time horizons e.g. day trades and short over night holdings. If markets open up a little then you can widen those time horizons. e.g. Just daily/ weekly charts in raging bull markets, down to 60/15/5 minute charts in coppy conditions. The intention isn't to day trade from the outset, but monitor things more actively when things are tough.

Here's a couple of trades that show what I mean (If I can get the attachments working :D )
 

Attachments

  • AAPL TRADE 02.11.2005.pdf
    412.4 KB · Views: 1,309
  • AMZN,15 - AdvCh.pdf
    214.5 KB · Views: 1,631
Will History Repeat Itself?

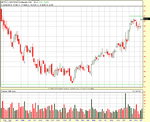
Attached is a weekly chart of BIIB which pretty much speaks for itself. However, I'll offer a few comments as to why it's caught my attention. The stock was last flirting with the $46 level in Feb '04, resulting in the large bull candle on very heavy volume. The daily chart reveals that the bulk of the move occured when the price gaped up to $51 - which then provided support a month or so later. Volume on the days preceding the gap up was weak and now, in December '05, it's even weaker - relatively. With Christmas upon us, it might be that the stock extends its horizontal work and, in so doing, builds up a head of steam for something spectacular in the new year.

On the other hand . . . a period of consolidation could well see another test of support at $42. Should this fail, the bulls could be shaken out of their positions and be accompanied by a frenzy of short selling which then results in the price plummeting right back down to the bottom of the range indicated by the lower green line at $34. Oooo, isn't it exciting? Place your bets now please ladies and gentlemen!

Happy Chrimbo to you all,
Tim.
 

Attachments

  • BIIB_16.12.05.PNG
    BIIB_16.12.05.PNG
    38.7 KB · Views: 518
Cup 'n' Handle

ISIL
A breakout of resistance at $27.00 on strong volume would induce Jo Public to pile in which could, in turn, result in a test of long term resistance at the decade number - $30.00. The strong bull candle on good volume kicked of the year well for ISIL but, there was no follow through last week, in spite of the increased volume. This could be some profit taking from the bulls that got in early on during the last week of October through to November. However, this doesn't seem very likely, as anyone who wanted to do this would surely have done so during the pull back to $24.00 during the first two weeks of December? Equally unlikely - to my way of thinking - is that the relatively poor performance last week is a result of fresh short selling. The doji on the third week of December indicates that the bulls are prepared to support the price around the $24.00 mark and, additionally, the low(ish) volume that accompanied the doji suggest that there is little selling pressure. One possible explanation could be that there are institutional buyers who want to accumulate more shares and don't want to allow a significant price advance until they've got their fill. If this is the case, then a strong price advance on the breakout of $27.00 becomes highly probable. Has anyone got any other explanations and or interpretations of the price action?
Tim.
 

Attachments

  • ISIL_13.01.06.png
    ISIL_13.01.06.png
    44.4 KB · Views: 460
I don't know who you trade with Tim but if you use CFDs or Spreadbets with CMC or IG you can have guaranteed stops for 'sleeping at night' purposes. They cost a little extra but if you're trading off weekly data you'll hardly notice it.
 
amgn might be worth a pop now people? Looks like some decent support. What do you think?

Millsy
 
millsy500 said:
amgn might be worth a pop now people? Looks like some decent support. What do you think?
Millsy

Hi Millsy,
AMGN is certainly interesting this week by virtue of the fact that the volume after just two days almost matches that of the whole of last week. The range of the candle is similarly impressive. If this continues, the volume bar could become huge, indicating a lot of activity. Has the price found support at the $73.50 mark and will the week end in a doji or even a higher price with a tantalisingly long spike? Well, clearly buyers are supporting price and to good effect, it would appear. But, as we all know, appearances can be deceptive! So, my thoughts are that price action is bullish in the short term at least, but I would want to wait to see if this results in a more sustained upward move for a swing trade. Presumably, the chart has already presented a reversal set-up off support for some traders who have jumped in early. The higher green line represents possible resistance at $78.00.
Tim.
 

Attachments

  • AMGN_24.01.06.png
    AMGN_24.01.06.png
    50.1 KB · Views: 473
Hi Tim

Thanks for the explaination. My thinking was to hold on a wee bit and wait for a decent reversal signal as it has been in a down trend for a while. completely missed the volume tho! Getting there slowly!

Millsy
 
Hi, I swing trade US stocks (mainly Nasdaq). I use Elder's triple screen method & it pretty much works for me. I try not to pay too much attention to the news as it only makes me second guess and therefore doubt my trading system, however, i don't ignore it either. By this I mean that if there's news that's likely to have a dramatically negative impact on the market, I will tighten my stops.

With regard to gapping, it's a risk that can be reasonably managed by avoiding stocks with a history of scary gaps and erratic moves. In the unfortunate event of having a stock gap against me, my strategy is to limit the damage by trading it back by allowing a breathing space and simply tightening the stop as it pulls back towards my break even.

I look forward to discussing swing trading of US stocks.

Saul
 
Hi folks,

I'm interested in swing trading as well -- trading the minor trends and break-outs. I'm fairly new to this game, hence I tend to stick to the basics. Trends, resistance / support, and volume are the key things I look for in charts. I trade US-based stocks exclusively, for the time being.

Attached are a couple of charts I'd consider interesting.
 

Attachments

  • RHAT_20061027.png
    RHAT_20061027.png
    31.1 KB · Views: 370
  • RMIX_20061027.png
    RMIX_20061027.png
    32.8 KB · Views: 347
Top