Swing trading technical analysis

Level_Trader

Active member
Messages
171
Likes
2
Dow Jones exhausted?

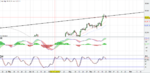
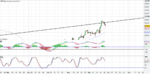
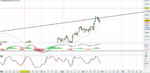
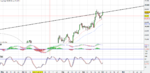
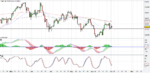
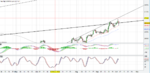
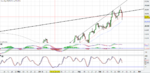
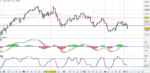
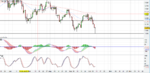
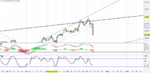
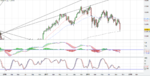
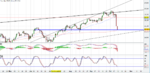
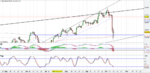
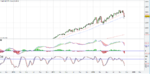
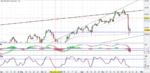
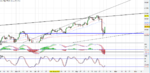
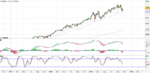
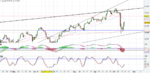
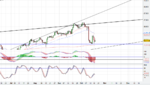
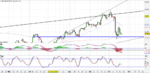
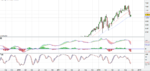
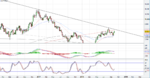
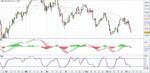
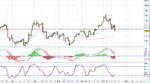
The daily chart shows the Dow retracing following the record highs that it hit a few days ago. It is likely to test the 20 daily moving average around 26,260 and my view is that it could go as low as 26,000 before buyers come in. The inverse hammer formation from today's trading action suggests we get some follow through on the sell side tomorrow but how big that sell off will be will be dependent on how hawkish Powell is in his press conference on the future path of monetary policy.
 

Attachments

  • DJIA Daily_25.09.18.PNG
    DJIA Daily_25.09.18.PNG
    99 KB · Views: 476
Dow Daily 26-Sep

The Dow Jones followed through as expected as the Fed raised rates and flagged more rate hikes and signalled the end of the accommodative policy era.
What was interesting was that US stocks started the session on the front foot and even into the Fed announcing the rate hike (which was widely expected) but came off after Powell's press conference.

From a technical point of view, the Dow retested the trend line highlighted in the daily chart which suggests that level will act as strong resistance going forward. Since the trend held, the 20 daily moving average at 26,275 looks pretty imminent. The MACD in the chart curving downwards does not help either and further supports a move lower.
 

Attachments

  • DJIA Daily_26.09.18.PNG
    DJIA Daily_26.09.18.PNG
    97.5 KB · Views: 371
Dow Daily 27-Sep

The Dow closed the day near the flat line with the lows coming close to the 20 EMA.
Apple played a big role in lifting the Dow today driven by JP Morgan giving the stock and overweight rating. Question remains to be seen whether the Dow simply floats in between the 20 EMA and the rising trend line tomorrow or whether it breaks out one way or another..

The USD on the other hand acted decisively and rebounded off the 9350 level. A close above 9300 keeps the bulls in control and it looks likely that the USD might make another run at the 200 WMA around 9560. It has been flirting with that 200 WMA for some time but it remains to be seen whether it can break above it decisively...
 

Attachments

  • DJIA Daily_27.09.18.PNG
    DJIA Daily_27.09.18.PNG
    94.4 KB · Views: 353
  • USD Daily_27.09.18.PNG
    USD Daily_27.09.18.PNG
    88.6 KB · Views: 333
US. vs European Equities 28-Sep

The Dow bounced almost to the point off the 20 MA around 26314. Based on the snap back I would say that it kicks on higher early next week and pushes the trend line resistance again.

The DAX on the other hand got hit as Italian budget concerns weigh on Europe. 12225 is key for the DAX which held for today. If this level breaks, expect the selling to intensify. On the upside any gains will be capped at the 200 DMA around 12500. Investors continue to back US. equities whilst Europe seems to be a mess...will this trend continue? .. next week should be an interesting week. Enjoy the weekend folks
 

Attachments

  • DJIA Daily_28.09.18.PNG
    DJIA Daily_28.09.18.PNG
    99.6 KB · Views: 359
  • DAX Daily_28.09.18.PNG
    DAX Daily_28.09.18.PNG
    94.2 KB · Views: 345
Dow Daily 01-Oct

The Dow 30 started the fourth quarter off on the front foot as US Canada and Mexico agreed to replace NAFTA.

The daily chart confirms what we suspected towards the end of last week which was a retest of the long term trend line. It even poked its head above the trend line but sellers came in to take profits hence the minor fade.
The 1hr charts suggests we might continue floating higher tomorrow potentially touching the all time high around 26,784 or even making a slightly higher all time high. I suspect we may pause and come back once that has been hit as note there is a gap up from last week.. the Dow now has a gap around 26500 which potentially could get filled by the end of the week.
 

Attachments

  • DJIA Daily_01.10.18.PNG
    DJIA Daily_01.10.18.PNG
    100.9 KB · Views: 349
  • DJIA 1 hr_01.10.18.PNG
    DJIA 1 hr_01.10.18.PNG
    86.8 KB · Views: 325
Dow Daily 02-Oct

...and there we have it.. record high for the Dow!
I mentioned in my last post that this was on the cards following the up day we had yesterday. The Dow again closed strongly right at the previous record high. It looks possible the Dow can go a bit more higher potentially around 27k. It did try to attempt to gap fil early in European trading but just missed out on closing that gap. It'll be interesting to see if it does come back to fill that.. could non farm payrolls be a trigger?

Meanwhile in Europe.. the DAX hangs on to the beloved 12225 level. Notice how we continue to hold that level. I wouldn't be surprised if we went close to the 200 daily moving average around 12500. If the weakness in the EUR continues expect the DAX to catch a bid but most importantly keep a watchful eye on that key support level of 12225.. if it gets taken out..it could get ugly...
 

Attachments

  • DAX Daily_02.10.18.PNG
    DAX Daily_02.10.18.PNG
    109.9 KB · Views: 399
  • DJIA Daily_02.10.18.PNG
    DJIA Daily_02.10.18.PNG
    108.3 KB · Views: 330
Dow daily 03-Oct

The Dow hit another record high but faded towards the close. The driver for the late sell off in stocks seemed driven by treasury yields pushing higher...the 10 yr hit 3.16%.
If treasury yields go much higher it will be a cause for concern for stocks. I've included the USD weekly chart in my post as this is going to be pivotal in where treasuries and ultimately stocks end up going. The strength in the US. economy is clear to see with the ADP employment report coming in stronger than expected. This boosted demand for the USD and pushed yields to a level which may start to make equity investors nervous.

In terms of levels, the 26,660 level where the bottom rising trend line sits is likely to be a level of support. If that gets taken out we'd be looking for gap fill around 26,500. On the upside, the top trend line around 27,000 is likely to act as resistance.
The USD is pushing towards a trend that connects to the high from the start of last year. If it breaks through this trend, the USD could rally sharply. Keep an eye on the average hourly earnings on Friday... if this comes in a lot stronger than expected, it could be the trigger. For now, 96 has to be strong resistance especially with the 200 weekly moving average also sitting around 9560
 

Attachments

  • DJIA Daily_03.10.18.PNG
    DJIA Daily_03.10.18.PNG
    109.8 KB · Views: 333
  • USD Weekly_03.10.18.PNG
    USD Weekly_03.10.18.PNG
    92.1 KB · Views: 302
Dow Daily 04-Oct

Gap filled! The Dow filled the gap up from the beginning of the week which I referred to in my post on 1st October. Notice how once it filled that gap it found some support with the 20 day moving average nailing the low of the day.
I've included the 1hr chart for reference to help confirm the gap around 26500 has filled.

The yield story is what is moving the equity market at the moment. It makes for an interesting day tomorrow because if the data on average earnings comes out better than expected, the yields will continue to rise and equities will pullback. The 10 yr is around 3.19%. Today, I believe was simply a taster. If the 10 yr goes past 3.25%, I believe things could get quite ugly for equities.. all eyes will be on that non farm payrolls report tomorrow. Keep an eye on that 10 year note!

I've also included the DAX daily chart showing how it continues to hug that 12225 support level. A close below that level would bring the sellers in.
 

Attachments

  • DJIA Daily_04.10.18.PNG
    DJIA Daily_04.10.18.PNG
    106.8 KB · Views: 339
  • DJIA 1 hr_04.10.18.PNG
    DJIA 1 hr_04.10.18.PNG
    94.7 KB · Views: 312
  • DAX Daily_04.10.18.PNG
    DAX Daily_04.10.18.PNG
    112.4 KB · Views: 450
Daily Analysis 05-Oct

The yield story continued to drag equities lower as the Dow retested the rising trend line confirming it as resistance. The Dow punched through the 20 daily moving average around 26460 breaking the low from yesterday but is trying hard to close back above it.
The non farm payrolls headline number came in weaker but there were positive signs with the average hourly earnings coming back in line with estimates and the unemployment rate coming in lower than expected. Overall the payroll report was strong which is why yields continued to rise.
It's very likely we will see some follow through at the start of next week with the Dow pushing the 40 daily moving average around 26200.

In Europe, the DAX bust through the key 12225 level. It's possible that a retest early next week to confirm this as resistance could happen but I ultimately think we go to around 11780/11800.

I've included crude in this post because I feel it is setting up for a big move next week which is ultimately lower. The set up technically is a bear flag pattern and it looks over extended based on the moving averages curving downwards. I believe we will see WTI pushing close to the 70-70.5 area which eventually closes the gap it created about 2 weeks ago.

Have a good weekend folks
 

Attachments

  • DJIA Daily_05.10.18.PNG
    DJIA Daily_05.10.18.PNG
    111.3 KB · Views: 323
  • DAX Daily_05.10.18.PNG
    DAX Daily_05.10.18.PNG
    111.4 KB · Views: 332
  • WTI_05.10.18.PNG
    WTI_05.10.18.PNG
    88.7 KB · Views: 301
Daily Analysis 08-Oct

That was some snap back we had late in the day but was that merely short covering or investors looking for bargains? With the S&P500 and Dow still near all time highs it may seem odd to start bargain hunting over a couple of percentage point drops.
Technically the daily chart on the Dow suggests we will follow through higher tomorrow as per my post last Friday we saw follow through selling early in the session today. The buyers came in around 26250 where the 40 daily moving average sits. I believe we'll make another run at the rising trend line pushing 26675/700. Question really is whether that holds...

The DAX on the other hand closed in on our target of around 11780/800. The LOD was 11898 but I suspect we'll get a bounce tomorrow if the US. kicks on higher. That said, I still believe we head to at least 11800 once the relief rally/bounce is over. The budget issues surrounding Italy are likely to continue for some time and its likely the DAX remains below that critical level of 12225.
 

Attachments

  • DAX Daily_08.10.18.PNG
    DAX Daily_08.10.18.PNG
    117.6 KB · Views: 312
  • DJIA Daily_08.10.18.PNG
    DJIA Daily_08.10.18.PNG
    109.9 KB · Views: 321
Daily Analysis 09-Oct

The DAX pretty much hit our interim target of 11800 (ok I was out by 2 points as LOD was 802...should have done better). The bounce level as predicted, happened around that level as the DAX made a comeback towards the close and finished near 12k. This bounce is likely to be short lived however. It's possible a retest of 12225 could happen but once this happens, expect the sellers to come back. Ultimately I believe we'll end up at the 200 weekly moving average which is around 11450/500 but we might bounce around a bit between 11800 and 12225 for the time being...

The Dow surprisingly didn't even bounce...based on the bullish close yesterday, a follow through of some sort was expected but that didn't materialise. The Dow instead sold off but has since snapped back again like yesterday. It's still possible that a bounce could occur but make no mistake, the way the Dow opened today shows there is underlying weakness. Eventually the 40 day moving average is going to be taken out around 26250. Once it does break that, the flood gates could open because apart from some minor support around 26k there isn't much support below that for another 1000 points!
 

Attachments

  • DAX Daily_09.10.18.PNG
    DAX Daily_09.10.18.PNG
    105.1 KB · Views: 318
  • DJIA Daily_09.10.18.PNG
    DJIA Daily_09.10.18.PNG
    104.3 KB · Views: 323
Daily Analysis 10-Oct

Well that escalated pretty quickly...

The Dow bust through the 40 daily moving average today and headed south pretty fast after that. As per my note yesterday, there isn't much stopping the Dow now until it gets close to the 25k mark. If we get a day like this tomorrow I would say we could even see a 25 handle on the Dow tomorrow. The media continue to blame rising yields for the move today but the 10 year is actually down today. This move has been purely technical as we noted yesterday, that once the 40 daily moving average was taken out, the sellers would come rushing in.

Keep a mindful eye on the Nasdaq.. because that is what is leading everything. Tech fell apart way before the S&P500 and Dow followed. I've included the weekly chart of the Nasdaq showing we are approaching a very critical level on the Nasdaq around 7044. If we get a weekly close below that which it hasn't done so for over 2 years, the selling will continue and all 3 major indices will begin to roll over. I'll be watching closely at that level to see whether this selling turns into a deeper correction.

The DAX also got crushed and it looks like that 200 daily moving average is imminent. I expect the DAX to touch around 11400-11450 at some point this week. After that we may get a bounce as that 11400 is a big level. Lots of great opportunities out there. Keep an eye on those key levels!
 

Attachments

  • DAX Daily_10.10.18.PNG
    DAX Daily_10.10.18.PNG
    97.8 KB · Views: 319
  • Nasdaq Daily_10.10.18.PNG
    Nasdaq Daily_10.10.18.PNG
    66 KB · Views: 307
  • DJIA Daily_10.10.18.PNG
    DJIA Daily_10.10.18.PNG
    102.7 KB · Views: 307
Daily Analysis 11-Oct

Volatility is the name of the game.

The Dow and the DAX hit both of our targets. Notice how the Dow bounced off around the 25k level and the DAX bounced off 11400 with the low coming in at 11398.

So where do we go from here? Equities still look weak but we could get a little relief rally or a bounce. For now, the key support levels are the levels above. If the DAX did break 11400 the next big level of support would be around 10600.
For the Dow, 24750 would be minor support should 25k get taken out but I would expect the selling to intensify if that 25k level is taken out because the 200 daily moving average is around 25100 which is not far off where the Dow is currently trading.

Continue watching the key levels and reduce size in times of excess volatility.
 

Attachments

  • DAX Daily_11.10.18.PNG
    DAX Daily_11.10.18.PNG
    95.9 KB · Views: 407
  • DJIA Daily_11.10.18.PNG
    DJIA Daily_11.10.18.PNG
    123.8 KB · Views: 300
Daily Analysis 12-Oct

The volatility continues as US indices look to rebound.

The Dow went from +500 in the futures to negative at one point but looks likely to close up today. The 25k level continues to hold...it got tested again today with the low coming in around 25004 and the DAX in the mean time continues to hold onto 11400 which is key support.
It's possible we move into a consolidation phase as the Dow continues to flirt with the 200 daily moving average around 25088.
I still believe we'll end up lower but there may be a few bounces along the way like the one today.
Keep an eye on the key levels next week to see whether we bounce around a bit or crash straight through it, in which case we'll continue to see this market crushed by the day.
Enjoy the weekend folks
 

Attachments

  • DJIA Daily_12.10.18.PNG
    DJIA Daily_12.10.18.PNG
    116.6 KB · Views: 310
Daily Analysis 15-Oct

The US equity market continues to hold onto the key support levels. Initially US stocks were heavily down overnight and gaped lower. The gap at 25358 got filled on the Dow just before the US. open.
The Dow hit a low of around 25120 which again is just above the 200 daily moving average.

The Nasdaq is also pushing against critical support once again. The weekly chart shows it tested the 40 week moving average again today around 7050. Again it bounced off this level but there seems an inevitability that this level will eventually get taken out. The equity market is struggling to gain any upside momentum at the moment. Continue to watch the key levels as the selling will intensify again, once the key support levels are taken out.
 

Attachments

  • Nasdaq Daily_15.10.18.PNG
    Nasdaq Daily_15.10.18.PNG
    80.4 KB · Views: 299
  • DJIA Daily_15.10.18.PNG
    DJIA Daily_15.10.18.PNG
    119.5 KB · Views: 332
Daily Analysis 16-Oct

It's turn around Tuesday!

The Dow closed up over 2% whilst the Nasdaq closed over 3% up. Just now we had some earnings. Netflix beat whilst IBM missed on revenue.

Looking at the charts, the Dow had a solid bounce and held the 25k level. That was always possible with conditions being very overbought and the 200 daily moving average holding for a couple of days around 25100. The Nasdaq reclaimed the 40 weekly moving average around 7060. So where do we go from here?..
My view is that there is some more upside potential with the Dow testing the 26k level and going as high as 26100 even. This is also just above the 50% fib retracement level from the recent sell off.
The Nasdaq has a little further to run and could hit 7360 with a max potential of 7420. These are big levels so once they hit, the sellers are likely to come in or those that are long are likely to take chips off the table.

These up moves are going to be as crazy as some of the down moves because the volatility has risen therefore expect bigger day ranges and trade with caution.
 
The Dow closed up over 2% whilst the Nasdaq closed over 3% up. Just now we had some earnings. Netflix beat whilst IBM missed on revenue.

Looking at the charts, the Dow had a solid bounce and held the 25k level. That was always possible with conditions being very overbought and the 200 daily moving average holding for a couple of days around 25100. The Nasdaq reclaimed the 40 weekly moving average around 7060. So where do we go from here?..
My view is that there is some more upside potential with the Dow testing the 26k level and going as high as 26100 even. This is also just above the 50% fib retracement level from the recent sell off.
The Nasdaq has a little further to run and could hit 7360 with a max potential of 7420. These are big levels so once they hit, the sellers are likely to come in or those that are long are likely to take chips off the table.

These up moves are going to be as crazy as some of the down moves because the volatility has risen therefore expect bigger day ranges and trade with caution.[/QUOTE]
 

Attachments

  • DJIA Daily_16.10.18.PNG
    DJIA Daily_16.10.18.PNG
    113 KB · Views: 280
  • Nasdaq Daily_16.10.18.PNG
    Nasdaq Daily_16.10.18.PNG
    81.3 KB · Views: 297
Daily Analysis 17-Oct

We had pretty much a nothing day as equities had a choppy session following Fed minutes showing they are on course to continue the rate hikes. The US Dollar was the real winner out of that headline.

The Dow looks on course to try and test the 26k level following the doji formation today. That will be a big test for the bulls if we get there.. to see if that resistance level holds.

I've included the daily crude chart as I posted on the 5th that crude would have a big week last week which it did. It managed to fill the gap it left around 7070 and sold off sharply on poor inventory numbers today. I expect the downside to continue with the next big support level around the 200 daily moving average at $68
 

Attachments

  • DJIA Daily_17.10.18.PNG
    DJIA Daily_17.10.18.PNG
    126.2 KB · Views: 263
  • WTI_17.10.18..PNG
    WTI_17.10.18..PNG
    90.6 KB · Views: 265
Daily Analysis 19-Oct

US stocks ended the week finishing slightly lower although the Dow managed to eek out a gain. There is an underlying nervousness brewing in the equity market at the moment as it struggles to hold onto gains.

The Nasdaq weekly chart shows an inverse hammer formation and highlights weakness as it hovers just above the 40 week moving average around 7050. It is entirely possible that this level gets taken out next week because the way it closed the week suggests there is potential follow through coming next week.

The Dow similarly gave up nearly all its gains and is delicately poised above the 200 daily moving average around 25100. Technology has been on an unbelievable run over the last year or so and I feel technology is likely to lead us lower so I will be watching the Nasdaq very closely especially that 40 week moving average. If the Nasdaq breaks, the other indices will follow. Next week could be big!
Have a good weekend folks
 

Attachments

  • Nasdaq Daily_19.10.18.PNG
    Nasdaq Daily_19.10.18.PNG
    79.5 KB · Views: 267
  • DJIA Daily_19.10.18.PNG
    DJIA Daily_19.10.18.PNG
    93 KB · Views: 275
Daily Analysis 22-Oct

It was a day of nothing for the Dow Jones whilst a day of something for the Nasdaq. The Dow and S&P500 closed relatively flat. Despite China boosting stimulus hopes, Trump talking up tax cuts in the US. and Moodys keeping Italy's credit rating stable, there wasn't much to show for it in the equity market.

The Nasdaq hung onto the 40 week moving average around 7050 as investors look ahead to earnings. I think the stage has been set for the big tech names. If one of the big FANG names miss this week it could be the catalyst for a breakdown. On the flip side we could push towards the 20 week moving average around 7280/7300 if earnings are better than expected.

The Dow looks like it wants to crawl higher but is also delicately poised near the 200 daily moving average. The MACD is beginning to turn a corner so there could be potential for some upside. However any upside is likely to be limited and constitute to inside bar action. Any longs should be tactical with a target of 25820/26000. Continue to watch the Nasdaq as that will be the trigger point for US equities.
 

Attachments

  • DJIA Daily_22.10.18.PNG
    DJIA Daily_22.10.18.PNG
    117.2 KB · Views: 260
  • Nasdaq Daily_22.10.18.PNG
    Nasdaq Daily_22.10.18.PNG
    77 KB · Views: 262
Top