Swing trading technical analysis

Daily Analysis 23-Oct

Volatility strikes back!

Equities made a remarkable recovery considering the S&P500 and Nasdaq were both lower by more than 2% whilst the Dow was down around 550 points at the lows.
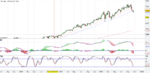
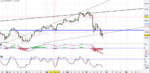
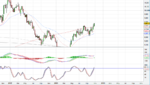
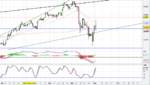
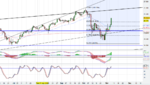
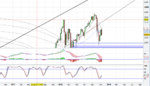
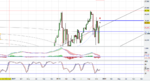
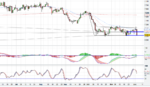
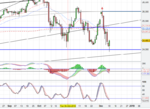
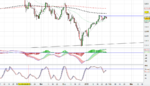
The media quote the driver being a rush into defensive and consumer staples stocks however if you look at the Dow daily chart, it was always going to bounce off that 24750 area as it hit the bottom part of the rising channel. If you look back at my post on the 11th, this was entirely possible once the 25k level was taken out.
I still believe this is minor support and the bounce we are having will most likely continue into tomorrow considering the sharp snap back we had today. We could still test 25400 and possibly 25500.

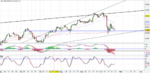
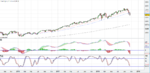
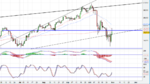
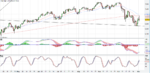
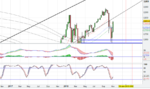
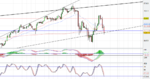
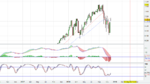
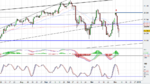
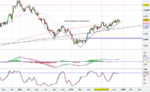
The Nasdaq also looked like it had broke the 40 week moving average only to recover above it. I believe for it to break convincingly a FANG stock will likely need to disappoint on earnings. The volatility is likely here to stay so continue to expect some crazy daily ranges on both the up and downside. Ultimately I think we go lower but there might be a few bumps along the way...
 

Attachments

  • Nasdaq Daily_23.10.18.PNG
    Nasdaq Daily_23.10.18.PNG
    86.4 KB · Views: 251
  • DJIA Daily_23.10.18.PNG
    DJIA Daily_23.10.18.PNG
    125.9 KB · Views: 257
Daily Analysis 25-Oct

Equities rebounded after a tumultuous day yesterday which saw major US indices breaking their 200 daily moving averages. The Dow came back today along with the other indices to retest that 200 daily moving average. On the Dow the 200 daily moving average sits around 25100 which we are not far from at the moment.. the highs were on point at the 200 DMA.

Tomorrow will be a big test whether the 200 DMA holds...if it does then the bears continue to hold control. The Dow could sneak above it intra-day and I think we could yet see 25200/250. There are US GDP numbers out tomorrow so that could create some more volatility.

I've included the US Dollar chart today because it looks to be making a run at breaking the 200 weekly moving average. I believe we could break through the downward sloping trend line that connects from the highs from the beginning of last year and target the 9750/9800 area. Fundamentally, if the GDP numbers come in line or better it will boost the greenback. A strong US dollar however is not good news for stocks as it hurts overseas earnings growth so keep an eye on the dollar vs equity correlation.
 

Attachments

  • DJIA Daily_25.10.18.PNG
    DJIA Daily_25.10.18.PNG
    118.5 KB · Views: 256
  • USD_Weekly_25.10.18.PNG
    USD_Weekly_25.10.18.PNG
    86.5 KB · Views: 251
Daily Analysis 26-Oct

Equities continued to fall as both Amazon and Alphabet missed on the bottom line in their Q3 earnings report.

The Nasdaq weekly chart closed below the 40 week moving average around 7042. Earlier in the week, I suggested one of the big names in technology could be the trigger to confirm a breakdown in the Nasdaq and it turned out to be heavyweights Amazon and Alphabet. The Nasdaq is likely to continue falling over the coming week and 6500 is likely to be the next big support level.

On the Dow, the daily chart shows it tried to retest the lower end of the rising channel around 24900. The Dow also looks like it will continue declining as it broke key technical levels, in particular the key 200 daily moving average around 25100. Expect further downside and any rallies are likely to get faded.
In terms of earnings, Apple reports next week so that could move markets substantially, worth keeping an eye on that one.

Enjoy the weekend folks
 

Attachments

  • DJIA Daily_26.10.18.PNG
    DJIA Daily_26.10.18.PNG
    119.3 KB · Views: 255
  • Nasdaq Daily_26.10.18.PNG
    Nasdaq Daily_26.10.18.PNG
    86.7 KB · Views: 282
Daily Analysis 29-Oct

What a turn around we had today.. all indices finished lower after being up quite significantly. It's very much a fade the rally market at the moment as the Dow daily chart almost re-tested the 200 daily moving average again. It also closed firmly lower beneath the second rising trend line confirming a breakdown. The Dow looks destined to want to test the 24k level which was the bottom from June this year (blue support line). I ultimately believe we end up going to around 23000/23100 which was the February lows. In terms of triggers this week, we have Facebook earnings tomorrow, Apple on Thursday and non farm payrolls on Friday. Any one of these events could trigger big moves either way. Expect it to be a volatile week!
 

Attachments

  • DJIA Daily_29.10.18.PNG
    DJIA Daily_29.10.18.PNG
    103 KB · Views: 273
Daily Analysis 30-Oct

US stocks had a big bounce on Tuesday as there was a late surge in the trading day.
The Dow daily chart shows that we have come back to that trend line we broke out from last week. There could be a test of the 200 daily moving average again at 25100 but then it is likely to face some more selling pressure.
Facebook beat on earnings after the bell but missed on revenue and daily active user numbers. The stock is down around 2% after hours which could impact sentiment tomorrow.. keep an eye on that 200 daily moving average tomorrow as the bears are likely to be tested.
 

Attachments

  • DJIA Daily_30.10.18.PNG
    DJIA Daily_30.10.18.PNG
    108.2 KB · Views: 257
Daily Analysis 31-Oct

US stocks finished the last day of October higher after what has been a bad month for bulls in a long time. The Dow rose as expected but pushed through the 200 daily moving average intra-day, only to finish right at the 200 daily moving average at 25100. The high of the day came around the the 20 daily moving average around 25300 but got faded towards the end of the trading session. It remains to be seen whether we break above the 200 day or whether today was simply a fake out to push stops on the short side. I believe today was an opportunity for weak shorts to get kicked out but there are Apple earnings tomorrow which is likely to dictate which way the Dow ends up going. With the fade we had today there is a possibility that we remain below the 200 daily moving average unless a blowout earnings report from Apple pushes us above it.

I've included the USD weekly chart as I mentioned in a post last week that the USD is looking to make a move to the upside...that looks to be materialising this week as we see it break above the 200 weekly moving average. I believe the USD has room to run and 9750 is likely to be the next level of resistance.
 

Attachments

  • USD Weekly_31.10.18.PNG
    USD Weekly_31.10.18.PNG
    74.3 KB · Views: 244
  • DJIA Daily_31.10.18.PNG
    DJIA Daily_31.10.18.PNG
    105.1 KB · Views: 247
Daily Analysis 01-Nov

US stocks continued rising for a third straight day as Trump revived hopes of US and China resolving their trade dispute. I am less optimistic anything will come from this but it created a feel good factor which boosted stocks.
The Dow daily chart shows that the 200 daily moving average (25100) has been breached and it looks like the Dow is heading for the 40 day moving average around 25550/25600.This will be a big test as it is a big level to overcome.
Apple just reported earnings with poor forward guidance for the rest of the year disappointing investors. The stock is down over 4% in after hours trading. This could weigh on the market tomorrow. There is also non farm payrolls tomorrow so that could dictate where we end the week.

The USD has come back to retest the 200 weekly moving average around 9560/9580. This was on the back of upbeat news that the UK is close to sealing a financial services deal with the EU. Again, the payrolls report will have a big say on where the USD finishes the week. Keep an eye on that number along with how the market reacts to Apple's weak guidance...if it continues to stay under pressure, it could well drag indices down with it!
 

Attachments

  • DJIA Daily_01.11.18.PNG
    DJIA Daily_01.11.18.PNG
    94.7 KB · Views: 248
  • USD_Weekly_01.11.18.PNG
    USD_Weekly_01.11.18.PNG
    81.1 KB · Views: 250
Daily Analysis 02-Nov

Three things weighed on the equity market today:
- Apple's forward guidance in its Q3 earnings report
- Higher yields on the back of a strong jobs report
- The white house playing games on a China deal

Apple remained under pressure all day and this certainly weighed on the Nasdaq and Dow. The non farm payrolls report came in at +250k which was better than expected and hourly earnings came in line which boosted the argument for further rate hikes.
However the biggest driver in my opinion was when Larry Kudlow rubbished claims that Trump had asked for a draft deal to be drawn up on China. We rallied for the last couple of days on this news but today we gave back some gains because it looks like fake news...
The Dow nonetheless did follow through initially and even surpassed my target of the 40 day moving average around 25550/600 with the highs coming in around 25720. The spike above was clearly a bull trap as it faded into the close finishing the day with a doji. Note, the lows of the day touched the 200 daily moving average so that continues to be key support. We need to break that for further downside.
The Nasdaq closed the week below the 40 week moving average around 7050 which is also significant because it maintains the bearish view since the price confirmed the break below the 40 week moving average. The Nasdaq daily attached shows we kissed the 200 daily moving average to the point at 7129.9. This will be key resistance and it looks like the downside is likely to continue next week. Keep an eye on the 200 daily moving averages on both charts as it will lead to big moves either way.
Have a good weekend folks
 

Attachments

  • DJIA Daily_02.11.18.PNG
    DJIA Daily_02.11.18.PNG
    101.5 KB · Views: 255
  • Nasdaq Daily_02.11.18.PNG
    Nasdaq Daily_02.11.18.PNG
    118.8 KB · Views: 238
Daily Analysis 05-Nov

We've got a bit of a divergence going on between the Dow & S&P500 versus the Nasdaq. Nasdaq was pretty much flat on the day with the main driver being Apple whilst the other major indices finished up.
You've got the Dow daily chart pretty much negating the negative close we had at the end of last week whilst the Nasdaq continued where it left off and finished with a doji. The Nasdaq recovery does have a bullish undertone to it and I wouldn't be surprised if all indices start on the front foot tomorrow. However the Nasdaq for example will have to overcome some big resistance levels in order to progress further. First hurdle is 7030 followed by the 200 day at 7128. Even if it gets past the first one it will most likely struggle to breach the 200 day.
With the Dow, the obvious target will be the 40 day moving average at 25530 with the next level of resistance around 25620. The biggest level for the Dow is around 25800. This is probably where it will struggle should it get to that level. On the downside 25300 and 25100 are key support areas.
 

Attachments

  • Nasdaq Daily_05.11.18.PNG
    Nasdaq Daily_05.11.18.PNG
    111.9 KB · Views: 282
  • DJIA Daily_05.11.18.PNG
    DJIA Daily_05.11.18.PNG
    111.8 KB · Views: 254
Daily Analysis 07-Nov

The mid-term elections went as expected which the equity market cheered.
All major indices surged and even breached 200 daily moving averages.
The Dow broke through the 61.8% retracement level around 25900. The next level on the upside would be 26400. It could potentially go as high at the top of the rising trend line around 26800.

The S&P500 looks set to test the rising trend line it recently broke out of around 2845. It should be said that we are approaching overbought territory on the Dow daily chart therefore a pull back is also likely. Tomorrow is also Fed day, although no rate hike is expected. The key will be whether the Fed signals a hike is coming in December.. as it could make the equity market jittery again with sellers coming in.
 

Attachments

  • DJIA Daily_07.11.18.PNG
    DJIA Daily_07.11.18.PNG
    110.8 KB · Views: 276
  • S&P500 Daily_07.11.18.PNG
    S&P500 Daily_07.11.18.PNG
    71.2 KB · Views: 243
Daily Analysis 12-Nov

US stocks got hammered today on veterans day with the bond market closed.
Lots of negative stories hitting key individual stocks:
-> Apple -5.04% as iPhone suppliers cut forecasts
-> Goldman Sachs -7.46% driven by Malaysia looking for a refund on the investment banking fees it paid out to the bank
-> General Electric -6.88% after CEO warning about the company's high debt levels and potentially being over leveraged.

All in all, a bad day for equities.. technically the charts also look ugly. The S&P500 daily chart shows how the rally stalled around the 8 day moving average. For the S&P500 to go any higher it will need to breach the 8 day.
The Nasdaq daily also paints an ugly picture. It formed an inverse hammer having held the 200 daily moving average. It did briefly fake out last week but this is looking more like a bull trap. The immediate target looks to be 6700 around the trend line...then we will have to re-assess.
Finally, I mentioned in a post on 31st Oct that the USD is breaking out. This is firmly in play as the dollar extended gains today against the EUR and GBP. It looks like it has finally made a move above the 200 daily moving average and 9750 looks to be the next level of resistance. Notice, there may also be an inverse head and shoulders pattern that could play out. If it does, we are potentially looking at around 102-103 on the USD. Plenty of upside remaining if this trend continues.
 

Attachments

  • USD Weekly_12.11.18.PNG
    USD Weekly_12.11.18.PNG
    78.1 KB · Views: 263
  • Nasdaq Daily_12.11.18.PNG
    Nasdaq Daily_12.11.18.PNG
    114 KB · Views: 261
  • S&P500 Daily_12.11.18.PNG
    S&P500 Daily_12.11.18.PNG
    86.8 KB · Views: 293
Daily Analysis 14-Nov

Equities continued their slide lower as all three major US. indices finished in the red.
Key stories/drivers:
-> Tighter regulation in banking industry expected as a result of Democrats winning the house hitting financial stocks
-> Broker downgrades on Apple with iPhone forecasts being slashed

The Dow daily chart shows we have reached the bottom trend line in the rising channel again. It has breached and closed below the 200 daily moving average. It's the same for both the Nasdaq and the S&P500.
If you look at the MACD indicator, we're only just about to cross over and head lower so there looks to be more downside coming. First level of support has to be 24500.

In commodities, crude rebounded today although it got crushed yesterday like there was no tomorrow. I've attached the monthly chart and you can see crude oil has been in decline ever since it hit that high in July 2008. It has been in steady decline ever since...note this is the monthly chart so it gives you an idea of how long this trend has been in play for!
It looks like the 77 handle we hit last month is a cyclical top and we'll continue to see further downside from here. The MACD again is only just about to cross over which is alarming. I think we could easily be back around $40 per barrel within the next 6 months. Crude is clearly a sell on any rally and any long positions should be tactical only.
 

Attachments

  • DJIA Daily_14.11.18.PNG
    DJIA Daily_14.11.18.PNG
    99.6 KB · Views: 258
  • WTI_14.11.18.PNG
    WTI_14.11.18.PNG
    86 KB · Views: 245
Daily Analysis 03-Dec:

Equities globally all gaped up overnight as the US. and China agreed to hold off on new tariffs during talks at the G20 meeting. There will be a 90 day grace period in order for the two countries to work out a deal. Whether this actually happens is still anyone's guess...
From a technical point of view, all major indices were faded but did not complete gap fill from Sunday night. I believe it will only be a matter of time before these gaps are filled. The DAX for example, gaped up only to run into resistance around 11500. It finished the day with an inverse hammer formation and looks set for some selling pressure tomorrow. The Dow, also faded and is likely to fill its gap around 25580. It probably won't stop there and will test the weekly trend line it broke out from last week around 25450.
The Nasdaq also faded and the weekly chart shows it held the 20 weekly moving average around 7100. This will probably hold and most likely gap fill will be targeted by traders at 6960. There's a lot of noise coming from France and it will be interesting to see if that starts to take over the headlines from the trade war truce... if protests and riots continue in France it could well turn sentiment and selling pressure could escalate...keep an eye on that
 

Attachments

  • DAX Daily_03.12.18.PNG
    DAX Daily_03.12.18.PNG
    79 KB · Views: 252
  • DJIA Daily_03.12.18.PNG
    DJIA Daily_03.12.18.PNG
    78.1 KB · Views: 281
  • Nasdaq Weekly_03.12.18.PNG
    Nasdaq Weekly_03.12.18.PNG
    65.4 KB · Views: 243
Daily Analysis 04-Dec:
Well that escalated quickly... The yield curve has come back into focus as the spread between the short end and the long end has narrowed to the point it has spooked the market. The 2 year and the 10 year spread is at its narrowest in over a decade and whose inversion has preceded the past three US. recessions. The trade truce euphoria has quickly faded too with Trump suggesting he will revert to tariffs if the US. and China cannot resolve their trade differences.
From a technical view, I was looking for gap fill as a minimum and we got more! Wherever you look on major European indices there are bear flags in play on the daily charts. Taking the DAX for example, not only did it fill its gap at 11334 but it also held the key resistance level of 11500. The MACD has also just turned lower so further selling is on the cards. The FTSE 100 also filled its gap from Sunday night around 7020. Again like the DAX, there is a clear bear flag in play and a break below 6900 and the flood gates will open. Keep an eye on that key support level. The Dow is below both 20 and 40 daily moving averages and is below the rising trend line once again. It closed below the 200 daily moving average which sits around 25230. Expect further downside in the coming days...
 

Attachments

  • DAX Daily_04.12.18.PNG
    DAX Daily_04.12.18.PNG
    91.2 KB · Views: 283
  • DJIA Daily_04.12.18.PNG
    DJIA Daily_04.12.18.PNG
    98.4 KB · Views: 301
  • FTSE 100 Daily_04.12.18.PNG
    FTSE 100 Daily_04.12.18.PNG
    99.1 KB · Views: 258
Daily Analysis 06-Dec

Stocks recovered from steep falls in early trading as futures pointed to an ugly open after Huawei CFO was arrested in Canada at the request of the US. casting fresh doubts over the prospect of China and the US. striking a trade deal.
From a technical perspective, the recovery from where S&P500 and Dow were both down over 2% is impressive. It could potentially signal a follow through tomorrow with a bounce likely/overdue. That said, any upside is likely to be capped around the 200 daily moving average on the Dow around 25200/250. The MACD has also nearly crossed over suggesting further downside is on the horizon. I wouldn't be surprised to see a pause day to a slight up day tomorrow simply because of the recovery we've had today in major US indices.
In Europe however, the FTSE 100 broke below the key 6900 level. Any bounce will likely find this level as a key resistance level with 6500 the next target on the downside. Expect volatility to continue...
 

Attachments

  • DJIA Daily_06.12.18.PNG
    DJIA Daily_06.12.18.PNG
    107.7 KB · Views: 271
  • FTSE 100 Weekly_06.12.18.PNG
    FTSE 100 Weekly_06.12.18.PNG
    99.2 KB · Views: 270
Daily Analysis 10-Dec:
Volatility is the name of the game. US stocks once again recovered from earlier losses which was triggered by the following:
- Inversion of yield curve continuing to stoke recession fears
- Chaos in France beginning to attract headlines driving risk off sentiment
- Apple being hit after Qualcomm Inc won a preliminary order from a Chinese court banning the import and sale of several iPhone models in China due to patent violations
- May cancelling a parliamentary vote on her Brexit deal with the European Union

However despite all the negative news on Apple Inc, it was the tech heavyweight that helped the sector and the overall market finish higher.

From a technical view, the Nasdaq recovered to close around the key 6700 level. It retested this level a couple of times breaking below on two previous occasions only to rally back above it. It remains to be seen whether this happens for a third time. I believe we could go higher tomorrow potentially to 6750-850 before it gets faded again. This is very much a sell the rally market now. Similarly with the Dow, it first gaped lower overnight before filling its gap. The Dow has potential to go to 24560 and as high as 24700 before it runs into strong resistance.
Aside from stocks, FX made a big move today as cable crashed following May's cancellation on the vote. The US Dollar weekly potentially shows an inverse head and shoulders set up. The 200 weekly moving average remains strong support and if this inverse head and shoulders plays out it sets up a potential target of 102 (some 500 pips higher).
 

Attachments

  • Nasdaq Daily_10.12.18.PNG
    Nasdaq Daily_10.12.18.PNG
    100 KB · Views: 244
  • DJIA_Daily_10.12.18.PNG
    DJIA_Daily_10.12.18.PNG
    76.4 KB · Views: 240
  • USD Weekly_10.12.18.PNG
    USD Weekly_10.12.18.PNG
    85.3 KB · Views: 249
Daily Analysis 18-Dec:

Sentiment continues to remain fragile as stocks reverse earlier gains. Energy is the big laggard today as production continues to rise whilst fears of global growth weakening is painting a bleak picture over future demand for crude.

I've included the WTI chart highlighting just how bearish the technical picture is too. Crude has been in decline ever since it broke the 200 daily moving average on 23rd Oct. It's been one way traffic ever since and its broken down further this week as it closed weak last Friday. At a minimum, crude is likely to hit around the 43 handle before it finds some solid support.

In equities, the S&P500 weekly chart shows all moving averages curving and pointing south with the S&P500 testing the February lows today. I believe we continue tracking lower and ultimately get to around 2350-2400. If we do get to 2350 level which is the 200 weekly moving average, I expect this to be a solid buy level as this major support level should hold on first attempt. If that did happen by the end of the week it is likely that seasonality then kicks in next week with lighter than average volume propping this market higher into the new year.
 

Attachments

  • WTI_18.12.18.PNG
    WTI_18.12.18.PNG
    78.1 KB · Views: 279
  • S&P500 Weekly_18.12.18.PNG
    S&P500 Weekly_18.12.18.PNG
    92.2 KB · Views: 286
Daily Analysis 28-Jan:

US stocks were lower today driven by weak earnings from Caterpillar and Nvidia. Earnings will be in full focus this week as some of the tech heavyweights report Q4 earnings.

The daily chart on the S&P500 suggests some bullish consolidation despite it being a down day today. We seem to be trading in a tight range with the upper and lower bounds being 2700 and 2620 respectively. Upside looks to be capped around the 200 daily moving average around 2700 (max upside 2750) and on the downside 2600-2620 would open the floodgates. The MACD is turning lower and looks concerning if you're on the long side. On the bull case, the S&P500 did gap down overnight so a beat by one of the blue chips could push the S&P500 higher and potentially enable it to reach gap fill around 2666. Stay nimble and keep an eye on earnings and updates on trade talks between the US. and China which kick off this week. I am expecting a choppy market with tight range trading until it can break out one way or another.

I am also including my weekly newsletter which contains a summary of the market action from the past week along with a technical outlook. It also contains open contract interest and upcoming macro events relating to the economic calendar. If you would like to receive this directly to your inbox on a weekly basis, please drop me a line/message and I can add you to the distribution list.
 

Attachments

  • S&P500 Daily_28.01.19.PNG
    S&P500 Daily_28.01.19.PNG
    93.9 KB · Views: 279
  • Level Traders Weekly newsletter_36.pdf
    210.4 KB · Views: 258
Is the FTSE 100 beginning to hit a wall?

From a technical point of view the weekly chart has managed to hold onto the rising trend line which hit a peak of around 7270. If it does begin to move lower the next big support level is around 7070 followed by 7000.
Optimism of a Brexit deal being reached and the threat of a no deal being talked down is boosting GBP. This is having the opposite effect on the FTSE 100.

The FTSE 100 is made up of large international organisations where a large chunk of revenue is brought in from abroad so a stronger GBP will reduce the value of overseas earnings and therefore weigh on future earnings. The opposite will happen if GBP weakens…
Keep a close eye on GBP as this will help guide us where the FTSE 100 is likely to go.

FTSE 100 Weekly_25.02.19.PNG
 
Market recap and thoughts for the week ahead (w.b. 5th Aug-19)
 

Attachments

  • Level Traders Weekly newsletter_56.pdf
    225.4 KB · Views: 202
Top