You are using an out of date browser. It may not display this or other websites correctly.
You should upgrade or use an alternative browser.
You should upgrade or use an alternative browser.
Naz
Experienced member
- Messages
- 1,391
- Likes
- 25
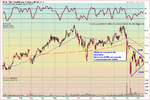
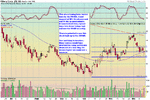
Hi Flea,
First of all i love the back drop on the chart.
Next i think the ma only come into play if your looking at a very longer term trade.Otherwise forget them.
Tthe top trend line is a bad fit and the only real support is the bottom one.The fibs look good as shown,bouncing off the 62% and 50 % retracement.
Finaly yes its worth looking at and i shall definately have it on my watch list for next week For a short if it takes out that bottom trend line.Many thanks for pointing it out.
Attachments
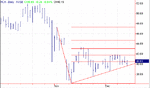
I agree about the top trend line but I think I was making the point that it was about a break of the bottom support line.
Not sure about the need for the fibs unless you are looking to short a rally up to these levels rather than a break down.
The reason I inclue MA's is the crossover can be significant and the trade could be for the longer term it's up to you.
Not sure about the need for the fibs unless you are looking to short a rally up to these levels rather than a break down.
The reason I inclue MA's is the crossover can be significant and the trade could be for the longer term it's up to you.
Mr. Charts
Legendary member
- Messages
- 7,370
- Likes
- 1,200
I wouldn't be too sure this was heavily shorted on Friday. It picked up nicely later in the session. Also if you check out both the Nasdaq index and sector Philly you will find similar patterns. ALTR is therefore moving in step. If you want to treat it as a tier 2 stock for following the leaders, fine.
In the same sector, XLNX might move on today's news.
In the same sector, XLNX might move on today's news.
I'm never sure of anything and yes I have noticed similar patterns amongst the Nasdaq stocks. These are ideas only. I'm not suggesting anyone trades them and I think you'll see from the title of the post that it is just an example of how I would use Fib levels.
Lets see a few of your ideas, Mr Charts
Lets see a few of your ideas, Mr Charts
Mr. Charts
Legendary member
- Messages
- 7,370
- Likes
- 1,200
Just adding to the debate, flea. No criticism intended whatsoever, so please don't take offence! ;-)
I trade intra-day only, sometimes only for a few minutes so anything I could say would be of little use to this board.
However, I am watching these for intra-day swings, reversals, breakouts etc today:
INVN IBM XLNX (which I did mention) MEDI BMY FRX
I trade intra-day only, sometimes only for a few minutes so anything I could say would be of little use to this board.
However, I am watching these for intra-day swings, reversals, breakouts etc today:
INVN IBM XLNX (which I did mention) MEDI BMY FRX
Mr. Charts
Legendary member
- Messages
- 7,370
- Likes
- 1,200
No problem flea.
Amongst my many failings I don't always express what I think as carefully as I should. I tend to appear too definite and dogmatic sometimes.
It's very easy in this medium to both give and take the wrong impression ;-)
Have a good day.
Amongst my many failings I don't always express what I think as carefully as I should. I tend to appear too definite and dogmatic sometimes.
It's very easy in this medium to both give and take the wrong impression ;-)
Have a good day.
Mr. Charts
Legendary member
- Messages
- 7,370
- Likes
- 1,200
VXGN took a big hit on Friday because of an article in Nature.
FDA approval today
= possible volatility to trade ;-)
FDA approval today
= possible volatility to trade ;-)
Mr. Charts
Legendary member
- Messages
- 7,370
- Likes
- 1,200
Well played, sir!
Mr. Charts said:Well played, sir!
Thanks Mr Charts. Obviously I don'tr get them all right but the key I think is risk reward. The stop at the 50 MA gave a fairly low risk to reward trade 🙂 .
I notice that you like to play news stocks which is something I've been looking at. May I ask who you use for a news provider.
I looked at VXGN intraday and it certainly moved but the spread looked a little frightening. I'm always concerned about the potential for blown stops with stocks like this.
Regards
flea
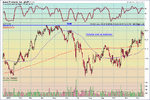
HCA
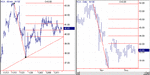
Some reflections on HCA triangle.
I would agree that chart looks appealing and price might breakout to downside but watch out prices have approached last 1/3 of triangle and break-outs from last third of triangle can be unreliable (see Trade for a Living, Elder). Positive is that Analyst recommendations are very positive (24-2-0). It might take a little longer both in terms of time and price before HCA breaks down. Thanks, I have put it on my watch list!
FTSE Beater
Experienced member
- Messages
- 1,518
- Likes
- 6
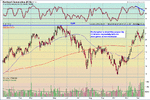
AVP
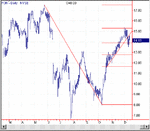
Hi Flea and all
I've been looking at this chart over the last week. I original found it on a scan as a cup and handle breakout, and I've been waiting all week for it to come back.

My main concern is that it might have retraced too far today, but I'm never sure about how far pullbacks can go and still be valid.
Any thoughts would be great on this 🙂
Hi Flea and all
I've been looking at this chart over the last week. I original found it on a scan as a cup and handle breakout, and I've been waiting all week for it to come back.
My main concern is that it might have retraced too far today, but I'm never sure about how far pullbacks can go and still be valid.
Any thoughts would be great on this 🙂
Similar threads
- Replies
- 4
- Views
- 5K