trendie
Legendary member
- Messages
- 6,875
- Likes
- 1,433
Another attempt to trade Sup and Res:
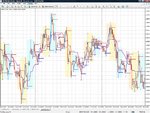
Using the 30-min S_R MT-4 indicator, I have added the Ichimoku indicator, set to 24/24 for Tenkan and Kijun. I have set all other bits of that indicator to "none" in "colours", to stop them showing, as they're not relevant.
Using the Ichimoku lines as trend-direction, how about trading the Sup/Res points as pullbacks into trend-direction as shown by Ichimoku?
I like the Ichimoku, since when trend slows or goes sideways, the line flatlines rather than whipsaws. This could alert you to a sideways market; certainly cuts down on chop.
I have added a screenshot of a relatively choppy market condition, GU last week, rather than "cheat" and show a perfect trending one. 😉
EDIT: I havent backtested this. But thought I would throw this out there to see what reaction I got.