Support, resistance and indicators

Hooya

Experienced member
Messages
1,802
Likes
2
anyway back to the thread title....


1)I just read some more of the previous posts and is seems that Elliott Waves are not classed as a Technical indicator? I understand why it might be considered a non indictaor method but imo its is just another representation of price. So I just wondered why some view it as different to say a Macd?

2) Also there seems to be alot of use of cycles and reversal times these days. ( I use them) but again I wonder why they to some are treated as more reliable than say an RSI when its oversold? I would suggest that they would perform equally aswell....

3) TA provides a secondary advantage that price only traders dont have maybe?

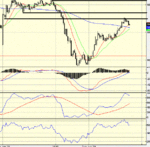
Price approaches resostance but there are 3 lots of resistance 15 points btween each...get it wrong and you are 30 points out of pocket...so could be expensive. So how would price only traders manage that sort of exit? Note macd at zero, RSI oversold, restest if 1 day ma for TA secondary reasons to go with the primary resisance?
 

Attachments

  • TA v Price.GIF
    TA v Price.GIF
    63.1 KB · Views: 534
Last edited:
Hi Hooya,

Hope you are well? Its been a while.

1) The reason that EW, i think, is not treated as a formal indicator is because it practically impossible to model/represent via a formula, unlike all indicators (MACD/RS/OBV etc).

2) As you know, i use RSI on the FTSE to trade and must admit it does give a lot false signals. There is nothing stopping the instrument in question from becoming more oversold and have seen this many times as i'm sure you have and i feel that is the main issue with it. Your chart on the way down is a good example of this. It is too inconsistent, but this inconsistency can be resolved with proper/better use, i.e. peak divergence.
Maybe it is because of this reason, coupled with fact that reversal cycles/times tend to be more specific that they are regarded more useful.

3) Having spent the last 5 months or so studying price/volume, i feel that i am far better equiped than when i was just using indicators. I would argue that i can use RSI better than b4 as i understand the underlying volume dynamics in the instrument.

With regards to the chart, i have seen the set up many times on the S&P. The gap/ very quick move up/down. This will lose momentum and will be confimed with desecending volume. The volume will then drop off as consolidation kicks in . I haven't checked by the way, but am just going by wot i see on the S&P. The set up i look for after this quick move is the the double bottom/double top.

The volume going in the the double bottom is decreasing. The second bottom usually occurs on slightly higher volume, but significantly lower than moving the in the high of the morning. This makes sense to me as MM will be taking profit, but will still want to encourage the crowd (who will still be in bull mode) to buy so they can unload the rest of their stock.

So, volumes dropping off on the move down gives the impression that the move down is weak and still got higher to go. The latecomers (weak hands) come to buy when they see the double bottom, as they get impatient and feel that do not want to miss any more of the move up. This is why, i believe at least, that the volume starts to increase on the move up to create the first top of the double top. The MMs dump some more stock. The double top will occur on higher volumes as the MM dump the rest of their stock thus causing the price to fall. i have found this a reliable reversal signal and is confirmed with the Negative Divergence on RSI on the double top ( the second top on higher volume).

I think this makes sense and feel it explains why the reversal is also very quick....late buyers who will exit quickly giving the move momentum, stops being taken out just below the double bottom 9 the natural place to put them if day trading i assume), and people covering quickly as they see their profit disappearing.

Hopefully we can discuss the move down 2morrow,

Fin
 
Okay Dokay....the move down.

I can't see any real concerns on the move down which would warrant a reason to exit the short trade. If you (not you personally) have no/little knowledge of price (volume) and have just pure reliance on indicators, i think this is where the trouble starts. The fact that RSI is oversold would tempt people into exiting the short trade when seeing the up bars, seeing this as the bottom..... but this is not a valid enough reason. If it is a true bottom, you would expect it to be tested in some way or another. Every bottom on the way down is tested and quickly taken out.

The two peak postive divergence marked the bottom nicely, but again would this be enough to close the short and initiate a long position? Again no. Why, because i need confimation. So no, but it certainly gives a heads up as to things changing and would be looking for confirmation of this.. It is confirmed soon after and you can tell just by looking at the bars that follow....they are all up bars closing near the high.

Here, the MMs will move the price up just enough to tempt the last (weak sellers) into the market to drive the price lower so they can accumulate more. So, when the turn down takes place, i would be expecting a retest of the low and looking for an exit and reverse. So where to exit? When the lower high is confirmed... this is when the high of the last down bar testing the low is taken out....i notice that this is very close to when the MACD and RSI crossover take place.

This confirms, to me at least, the need to at least understand price/volume dynamics to make leading judgements and THEN the use of a/many indicator(s) for confirmation. This is the complete opposite to how i first traded, relying purely in indicators as i was trying to take short cuts...oh how life changes!!!
 
Looks like Hooya has deserted me!!

Not to worry, because i'm going to continue regardless as its a topic i'm interested in, so i will continue to post.....maybe in vain, but hopefully so others can join in.

If not, then i am happy to rample on, at least, to clarify my thinking of the subject.

Being a trader, i'm sure i'll hear the words SUPPORT and RESISTANCE countless times throughout my trading career.......its got support at so and so, we're coming upto resistance, etc.etc. The terms are used openly and everybody seems to understands them.

However, when the words are used, do the people using them and the people acknowledging them necessarily mean the same thing. i.e. are the notion and the perception the same for everyone?

I suppose what i'm really trying to do is develop a deeper understanding of the Ws (what, when, why) of support and resistance, refering to charts for reference and analysis for common characteristics and ways to gauge the strength thereof...maybe this is where the use of indicators come into play.


Dealing with SUPPORT first and a good place to start is a formal definition from the good old Oxford Dictionary....

I've picked out the meanings, which to me, make most sense in trading context..

support (v) -
1) to keep from falling or sinking
2) to hold in position
3) to bear the weight of
4) to give strength to
5) to enable to last or continue

Time to ponder me thinks!!
 
Top