INT. FX trading
Junior member
- Messages
- 18
- Likes
- 0
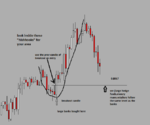
In your third chart.....".hishooks"....is that WD Gann stuff ?
hi, i saw it afterwards "fishhooks" insteed of hish.. srry (misspelling)
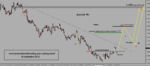
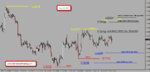
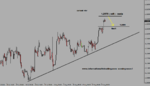
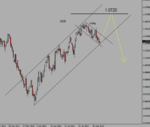
Hi,the IFX team buy euro @ market price (1.2340 ) stop @ 1,2220 , limit @ 1.2700
Hi,
In this chart you have:
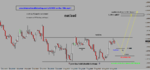
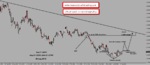
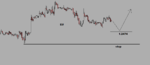
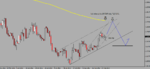
~labelled a v-shape
~predicted (suggested) a neck join/right shoulder (RS) 'may' form to create an inverted h&s
the v-shape though is an inverted head & shoulders on the daily? i understand you can have 2 h&s form but anyone using this pattern would have been looking to get long @12170 - the bottom of the RS of a H&S.
edit: sorry, after zooming in on the d1, i see the 12250 level was the next d1 demand level i would identify as a possible area for a long, which its been hitting since the 10th aug on a couple of occasions. I just cannot see a demand level even on the lower t/fs at your entry point.
Please can you elaborate as to why the first h&s formation was ignored? Just guessing, but perhaps you only take trades after a 'v'? Or you require a bigger time/space formation of an h&s?
Many thanks.
hi everyone... is the correction finally over on lower TF ?
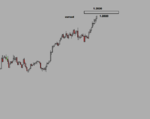
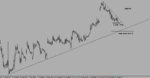
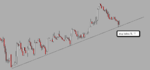
IFX-Team orders trigger overnite . long GU & EU .. both charts attached. will post later our targets. both pretty much a swing setup.
take care !
oh dear looks like the spike down took out your stop,thats 0 from 1,you even call a losing trade late,thats original
i dont think you can draw correct trendline ?
International FX Trading is coming soon will help you my friend 😉
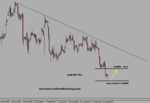
eur/aud - IFX-team sold @ market for a 105 pip drop. limit & reverse @ 11940's
see you all in the opening of IFX !!!
the IFX team buy euro @ market price (1.2340 ) stop @ 1,2220 , limit @ 1.2700
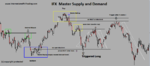
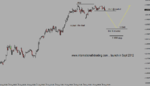
Gap occurred about the 24th of April and hoping for a GAP close in August (from the diagram). Some questions:
1. How big is the GAP in pips?
2. and how long does this trade go offside (in pips) before the close?
3. What is the Risk/Reward ratio of this trade?