chrisw said:
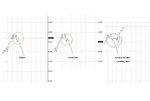
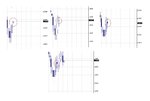
The price is currently 1.8800. In the last hour a triangle has formed and is coming to the end. Its sitting on the edge of the upside and looks like its going long. Then the price moves 5 pips above the triangle to 1.8805, but then retraces to 1.8800, the chart shows no signs of the move up at all, and then drops back down through the triangle and heads south.
Now I think we are all starting to get confused.
Sorry I would not have mentioned level 2 if I realised that you were speaking of forex, though the principles are still the same.
When you say "Then the price moves 5 pips above the triangle to 1.8805, but then retraces to 1.8800" what exactly do you mean? To me, it sounds as if you are saying that the price on the chart shows 1.8805, then the next price shows 1.8800, if that is so, then that is because this was the last 2 actual trades that went off.
But then you say "the chart shows no signs of the move up at all", which sounds like you saw the price on something other than the charts, as you mention that they didn't happen on the chart
😕
OK, the price (last trade) is 1.8800
The next trade is when someone buys at 1.8805
The next trade is when someone buys at 1.8800 (no-one else wanted to trade at 1.8805, 1.8804, 1.8803, 1.8802 or 1.8801
A chart in this instance would show the price at 1.8800, then immediately jump to 1.8805, then jump back down to 1.8800 without stopping at any of the prices in between. The chart ONLY shows actual trades.
Think of a "dot to dot" book, the dots may be very close to each other for most of the picture, but some could be quite a distance away. The line (bar on a chart) would show these two points (trades) joining, but wouldn't stop anywhere in between them as there were no more dots (trades).
So am I correct in thinking that happened due to the sellers wanting a better price before selling to make more profit,
WHY there were no trades at this price could be for a multitude of reasons, but it boils down to one thing - no one wanted to buy at those prices - so no trades.
why don't they show on the charts? If the price moved, should it not show on the chart if its a tradeable price? ie quoted in the SB website.
A spread bet company is really a financial book maker, not a broker. You do not actually trade the underlying instrument. In this case you have not bought any currency at all - just 'bet' on the movement. Thus as there were no trades at these prices, you could not bet on them. You would have needed a 'proper' forex account to have the option of doing this.
Hey, just be thankful you are not spread betting on Nasdaq stocks. You can buy a stock one day, and the thing can open the next morning a couple of dollars lower ie. 0.0200 pips to the dowside with no movement in between!
In this case, you 'may' have a chance of getting out on a direct access broker a little easier, but not with a spread bet company as the stock didn't actually trade there during market hours.


