You are using an out of date browser. It may not display this or other websites correctly.
You should upgrade or use an alternative browser.
You should upgrade or use an alternative browser.
dbphoenix
Guest Author
- Messages
- 6,954
- Likes
- 1,266
Forgive me for butting in, but it seems to me that sulong is trying to talk about strategy and tactics, not conduct a Socratic symposium on the definition of "breakout", "pullback", etc.
Anyone needing a refresher in breakouts, pullbacks, etc. may find "Rectangles" at my Yahoo site helpful. Or maybe not. But it's there if anybody wants to look through it.
Anyone needing a refresher in breakouts, pullbacks, etc. may find "Rectangles" at my Yahoo site helpful. Or maybe not. But it's there if anybody wants to look through it.
barjon
Legendary member
- Messages
- 10,752
- Likes
- 1,863
sulong said:I would say thats a good plan, for the first step in trade management.
sulong
and then? If it moved in the right direction I'd be looking to add on the next swing pullback and then once more on the next (with stops adjusted to protect overall profits). Do you favour pyramiding like this? If so with equal or scaled down positions?
If this is moving off topic and you don't want to get into it then just ignore.
jon
dbphoenix said:Forgive me for butting in, but it seems to me that sulong is trying to talk about strategy and tactics, not conduct a Socratic symposium on the definition of "breakout", "pullback", etc.
Anyone needing a refresher in breakouts, pullbacks, etc. may find "Rectangles" at my Yahoo site helpful. Or maybe not. But it's there if anybody wants to look through it.
You may be correct but it is of interest and use to us novices, or me at least.
Now that I have the relevant charts with the relevant comments I can see I was confused because a post was made and refered to a chart and it was replied to using a chart of a different instrument. Somewhat confusing.
Probably best not to refer to Socrates, it may bring back painful memories to some of our readers.
Have now completed reading S/D, Whats A Chart and In The Journey Not The Path files but will undoubtedly read them several times again. Moving on to Bases & Rectangles.
Regards
bracke
JumpOff
1
- Messages
- 702
- Likes
- 14
dbphoenix said:Forgive me for butting in, but it seems to me that sulong is trying to talk about strategy and tactics, not conduct a Socratic symposium on the definition of "breakout", "pullback", etc.
Anyone needing a refresher in breakouts, pullbacks, etc. may find "Rectangles" at my Yahoo site helpful. Or maybe not. But it's there if anybody wants to look through it.
Advice to all newbies, and perhaps to veterans too (if your confused about this thread in any way):
Go read the rectangles file on dbphoenix's site. You could buy and read 10 different books on technical analysis and still not get a clearer explanation of "what is a break out?" and "how should I trade one if I see one?"
Perhaps you're thinking it would just be easier to follow this thread, but I'd like to suggest that the little bit of time required to get the adobe .pdf reader and downloading the files is well worth the effort.
-Not to denigrate this thread, - which I am following with interest, but I'm sure I couldn't have understood it properly if I hadn't covered the basics first.
JO
JumpOff said:Advice to all newbies, and perhaps to veterans too (if your confused about this thread in any way):
Go read the rectangles file on dbphoenix's site. You could buy and read 10 different books on technical analysis and still not get a clearer explanation of "what is a break out?" and "how should I trade one if I see one?"
Perhaps you're thinking it would just be easier to follow this thread, but I'd like to suggest that the little bit of time required to get the adobe .pdf reader and downloading the files is well worth the effort.
-Not to denigrate this thread, - which I am following with interest, but I'm sure I couldn't have understood it properly if I hadn't covered the basics first.
JO
Agree 100%. See my post 60
sulong said:A #2 condition, looks to be presenting it self in the NQ.
Hugging R at 1534 - 37.
Will watch for a test, successful / failure, or for more of the same. :|
sulong
I take it that you are referring to #2 in your post 48 " A contraction of the daily range with price continually testing s/r area"
I note that volume is reducing, which as I understand it adds support to the idea of a congestion area. If I am correct with my understanding will you be looking for increased volume when the break occurs ?
or will you still take the trade if it breaks down without increased volume ?
Regards
bracke
bracke said:sulong
I take it that you are referring to #2 in your post 48 " A contraction of the daily range with price continually testing s/r area"
I note that volume is reducing, which as I understand it adds support to the idea of a congestion area. If I am correct with my understanding will you be looking for increased volume when the break occurs ?
or will you still take the trade if it breaks down without increased volume ?
Regards
bracke
Yes, the contraction thing.
The thing about volume, and my view of it, is I don't really see a change of volume as a "real time" signal, the way others do.
To me, once I see volume coming into the market, it means I'm late to a trade.
( talking about bo from congestion)
As far as low volume congestion or high volume congestion, they both store up energy, it's just for different reasons. I think that once you see congestion taking place, the next important thing is the duration of the congestion.
I don't mean to say that I don't observe volume. It's just that for me, volume is a more of a warning signal, as opposed to an enabling signal.
sulong said:Yes, the contraction thing.
The thing about volume, and my view of it, is I don't really see a change of volume as a "real time" signal, the way others do.
To me, once I see volume coming into the market, it means I'm late to a trade.
( talking about bo from congestion)
As far as low volume congestion or high volume congestion, they both store up energy, it's just for different reasons. I think that once you see congestion taking place, the next important thing is the duration of the congestion.
I don't mean to say that I don't observe volume. It's just that for me, volume is a more of a warning signal, as opposed to an enabling signal.
sulong
Thank you for your reply
Did you trade the nasdaq early fall yesterday ? If so what was the signal that prompted your entry and exit ?
I show the chart below but could not add volume as I would have liked. If anyone else can show the chart with vol it would be appreciated.
Regards
bracke
Attachments
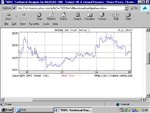
Bracke - that's the 100 index, so volume is not applicable. Here is the 5min futures chart with volume. I've been watching this for a while now and like it's action - less "spikey" than YM, and similar to ES with regard to the horizontal levels of S/R. Please try to ignore the date, as I'm a day ahead so to speak, due to PC clock and being in NZ. This was Tuesday 9th. I left my attempts at S/R lines, so anyone is welcome to comment. I was tempted to take the long off 28 at the end of the lunch channel, but failed to. Made two trades and came out +1.5, which is ok I suppose. 🙄
I would like to thank sulong and dbp for all their efforts on this thread, and elsewhere. (Your recent price and volume practicum document is fantastic db, many thanks for your continued efforts!)
I may not post too much for a while as I'm going through some inner turmoil at the moment. All down to poor discipline I'm embarrassed to say! I've read many times that you have to experience significant personal loss to really learn from your mistakes - I believe that the level at which my most recent mistake happened will be sufficient to teach me the most important lesson of all, that being discipline!
I will keep watching and hopefully learning, so please keep up the efforts.
Cheers
Q
Attachments
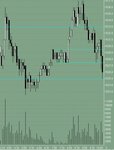
Quercus said:Bracke - that's the 100 index, so volume is not applicable. Here is the 5min futures chart with volume. I've been watching this for a while now and like it's action - less "spikey" than YM, and similar to ES with regard to the horizontal levels of S/R. Please try to ignore the date, as I'm a day ahead so to speak, due to PC clock and being in NZ. This was Tuesday 9th. I left my attempts at S/R lines, so anyone is welcome to comment. I was tempted to take the long off 28 at the end of the lunch channel, but failed to. Made two trades and came out +1.5, which is ok I suppose. 🙄
I would like to thank sulong and dbp for all their efforts on this thread, and elsewhere. (Your recent price and volume practicum document is fantastic db, many thanks for your continued efforts!)
I may not post too much for a while as I'm going through some inner turmoil at the moment. All down to poor discipline I'm embarrassed to say! I've read many times that you have to experience significant personal loss to really learn from your mistakes - I believe that the level at which my most recent mistake happened will be sufficient to teach me the most important lesson of all, that being discipline!
I will keep watching and hopefully learning, so please keep up the efforts.
Cheers
Q
Quercus
Thank you for your reply and the chart.
I am not sufficiently experienced to make too many comments about your s/r lines other than to say that there appear to be a number places where others could be drawn.
Agree with your comments relating to sulong & dbp. Have not read the practicum document yet but will be applying for it shortly.
Experience is a hard taskmaster. I hope your lesson is well remembered and that you come out of it a better trader.
Regards
bracke
I'm adding a little something to a prior post. (# 48)
1. An expansion bar, an a daily basis, ( not required, but helpful) reaching a previous strong S/R area. (1st chart)
2. A contraction of the daily range, with price continually testing the S/R area. ( in this case, for 2 days, but for 1 day, may be enough for a lesser move.)(first chart)
3. After 1 and 2, draw lines across the tops and bottoms of the "congested prices", and wait to see if price breaks out by 5 points +/-.(second chart)
4. If price breaks out by 5 +/-, and then pauses, before coming down, look for the first completed bar in the opposite direction of the break out, to have a lower volume bar associated with it, than that of the preceding bar that closed in the break out direction.( does this last part make sense?) (last chart for the rest)
5. If 1 through 4 are in place, enter at the first break of the of the end of the most recent completed bar, in the direction of the break out.
6. place stop loss at the end of the entry bar. ( +1 tick is your choice)
A pullback is still a pullback, until
1. viewable volume on the pull back is more than that of the break out.
2. price enters the prior congestion zone, that it broke out of, by 4 ticks or more.
These specifications are for a possible reentry.
dbphoenix
Guest Author
- Messages
- 6,954
- Likes
- 1,266
sulong said:A pullback is still a pullback, until
1. viewable volume on the pull back is more than that of the break out.
.
On the other hand, one must also be open to the possibility of a shakeout on a pullback, at least on a daily chart.
dbphoenix said:On the other hand, one must also be open to the possibility of a shakeout on a pullback, at least on a daily chart.
It seems to me that, a shakeout, whether it is from a deep pull back or at the top or bottom of a range, would be more of a reversal type of trade.
The other thing, is that a failed pull back, can mean a stretching of the range, that you're looking at breaking out of.
dbphoenix
Guest Author
- Messages
- 6,954
- Likes
- 1,266
sulong said:It seems to me that, a shakeout, whether it is from a deep pull back or at the top or bottom of a range, would be more of a reversal type of trade.
The other thing, is that a failed pull back, can mean a stretching of the range, that you're looking at breaking out of.
Shakeouts don't necessarily have anything to do with reversals. They maintain their function wherever they occur. In any case, reversals occur within a range. Retracements or pullbacks take place outside of the range. Unless you're defining all of this in other ways for your own use. But that can create its own problems.
sulong
Your post # 96
My own preference ( due to the time I need to analyse and make decisions ) is not day treading by design but occasionally by necessity. So what I have to say may not be relevant.
You appear to be advocating a 'mechanical' form of trading rather than bespoke trading as a result of considered analysis.
I know that previously you have said that you are looking for patterns ( or something similar ). Does this mean that you are looking to 'mechanically' trade the patterns you identify ?
I am not decrying this form of trading but I am very wary of it, having read a number of methods of this type on this site which appear to have varying success.
Does this mean that you are looking for the mechanical as opposed to the bespoke ?
The above is not meant as a criticism ( sulong you may not think it is but others may ) but seeking clarification if the thread is aimed at the mechanical as opposed to the bespoke.
Regards
bracke
Last edited:
Similar threads
- Replies
- 81
- Views
- 25K