Strategy development

sulong

Active member
Messages
249
Likes
16
I thought it might be useful to begin a thread for developing strategies for P,V,S/R, S/D.
Edit:
P= price
V= volume
S/R= support/resistance
S/D= supply/demand
BO= breakout
PB= pullback
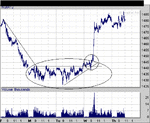
We recently had a good example of a BO followed by a PB.

Q. What are some appropriate rules, that would have allowed entry, in the correct direction, and making a profit.

what was the setup?
What was the entry trigger?
What was the initial stop loss?
What are the conditions for exits?

Just as well get ready for the next one.

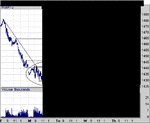
One chart shows before and after, the other one shows decision time.
 

Attachments

  • 10282.gif
    10282.gif
    13 KB · Views: 796
  • PB.gif
    PB.gif
    21.5 KB · Views: 721
Last edited:
Excellent idea. If I may make a suggestion, tho, using TLs with something that trades 24/7 may trip you up more often than it helps. Note here, for example, that price seems to find S at the TL. However, that TL was breached hours before. The S is found instead in that support zone that you like, the one from the previous afternoon.
 
sulong

Just a suggestion that you type out the full meaning before moving to abbreviations.

I know how frustratiing it can be for new entrants when trying to understand posts with abbreviations.

Regards

bracke
 
Perhaps I over estimated the need of traders to do these type of exercises. :confused:
Nevertheless, I know this sort of thing helps me, even though it may be a review of what I already know.

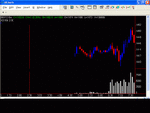
The first thing I see, is a steep down trend, which, on a daily basis, prints a long range bar, with the close being at the bottom of the range.
The low of Fri's. action is acting as a resistance area, for Mon's. am price action.
Price is struggling to make lower low's.( lwr/lo's getting rejected?)

Can anybody confirm my observations? Or better yet, add to them?

Note: I made a mistake on the days, in my first attempt. it's now correct.
( changed mon./tues to fri/mon )
 

Attachments

  • first thing.gif
    first thing.gif
    7.5 KB · Views: 583
Last edited:
I know that you look at what you call "tick pressure". What did you notice on the 25th and 26th?
 
dbphoenix said:
I know that you look at what you call "tick pressure". What did you notice on the 25th and 26th?


I wasn't observing the whole trading day, on those days, but, when the pressure picked up, the price quit moving, when the price started moving, the pressure lessened.

This action was observable at the previous lo of fri. (the 22nd?) and also at each attempt at a new low.
 
So do you have a tentative conclusion or a hypothesis regarding this action?
 
dbphoenix said:
So do you have a tentative conclusion or a hypothesis regarding this action?

Basically, traders are becoming very particular on what is the fair price.
When the tick action picks up,and there's no price movement, it seems to be a consensus of fair price.

When the price is moving, and the tick pressure is lessening, those traders on the wrong side of the immediate market, are cutting there losses.

The struggle to make lower lows, is a test to see if the price is low enough to create a "get out at any price" atmosphere.

Wash, rinse, repeat.
 
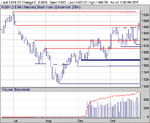
Look at daily charts of the NQ and ES covering the last four months and locate the potential S/R (no TLs).
 
dbphoenix said:
Look at daily charts of the NQ and ES covering the last four months and locate the potential S/R (no TLs).

Are you referring to the next closest ones to todays price?
Or follow the price around, looking at previous S/R? (There's quite a few of them, depending on where the focus is)
 
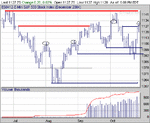
ES always looks too chopy to me, but I've drawn lines across the prices where I believe to be the strongest place to find future S/R.
 

Attachments

  • 4mES.GIF
    4mES.GIF
    11 KB · Views: 513
  • 4mNQ.GIF
    4mNQ.GIF
    10.3 KB · Views: 468
sulong said:
ES always looks too chopy to me, but I've drawn lines across the prices where I believe to be the strongest place to find future S/R.

Okay, this is pretty much what I have. But take another look at the line you have drawn on the NQ beginning at the swing high at the beginning of August. Now look at that base in the middle of September. Al else being equal, a base is going to provide more S/R than a swing point because more shares are being traded; therefore, more traders have something to gain/lose. If you nudge that line up just a couple of points, you have a more significant S/R line, at 1420.

Now look at the ES. As you know, the fact that price dipped below the line you have drawn at 1094 and pulled back above it confirms its importance, at least then. Therefore, the wide range bozo the next day should not come as much of a surprise.

Also important is the fact that while the NQ and ES are no longer trading in parallel, i.e., the NQ is considerably stronger than the ES, each is finding S/R in the same places within their own individual contexts. In other words, each is finding S/R at the same time, but not at the same levels; they aren't trading in parallel exactly, but in a kind of offset. There are days when they trade in opposite directions, and days when one will take off and the other will just sit there. But within the contexts of each chart, they are finding S/R at the same time. For example, NQ didn't do much of anything on Tuesday while the ES took off. But each did find S on Monday and Tuesday within the contexts of their own individual charts.

Let me know if you understand what I'm trying to get at and then I can either try again or we can move on.
 
dbphoenix said:
Now look at that base in the middle of September. Al else being equal, a base is going to provide more S/R than a swing point because more shares are being traded; therefore, more traders have something to gain/lose. If you nudge that line up just a couple of points, you have a more significant S/R line, at 1420..

Yes, I was trying to illustrate that with the lines at the far right of the chart, but didn't know how to make the lines "thicker", to encompass that zone.

dbphoenix said:
Now look at the ES. As you know, the fact that price dipped below the line you have drawn at 1094 and pulled back above it confirms its importance, at least then. Therefore, the wide range bozo the next day should not come as much of a surprise.

Also important is the fact that while the NQ and ES are no longer trading in parallel, i.e., the NQ is considerably stronger than the ES, each is finding S/R in the same places within their own individual contexts. In other words, each is finding S/R at the same time, but not at the same levels; they aren't trading in parallel exactly, but in a kind of offset. There are days when they trade in opposite directions, and days when one will take off and the other will just sit there. But within the contexts of each chart, they are finding S/R at the same time. For example, NQ didn't do much of anything on Tuesday while the ES took off. But each did find S on Monday and Tuesday within the contexts of their own individual charts.

Let me know if you understand what I'm trying to get at and then I can either try again or we can move on.
Yes, I get it.
I've been looking at these charts, and can't really find anything else to add to what you already said.
Except perhaps, it looks to me like NQ closed on support, and ES closed under resistance zone..@ 1127 - 1130. Which only supports what you said.
 
sulong said:
Except perhaps, it looks to me like NQ closed on support, and ES closed under resistance zone..@ 1127 - 1130. Which only supports what you said.

Well, not really. Just because price moved thru NQ R doesn't mean that R failed. R doesn't become S until price clears it and tests it from the other side. Price could easily drop back through, and given the R situation in ES, that's not an unreasonable possibility.

In any case, there are a few things I don't want to gloss over here regarding the patterns of each of these. Note, first, where the NQ finds S at the end of September. Now look at ES. It seems to find S in midair, failing to return to that 1094 level. However, if you look at those two congestion zones below those swing points you have circled and think of these areas -- and not just a line -- as support, the dynamic makes a little more sense. It also gives the trader more flexibility. If he then focuses on where the trading activity picks up, he's more likely to detect the turning point than if he were to wait for some line to be hit.

Next comes early October. The ES finds R higher in its range than the NQ, but the NQ finds its own R in its own chart at the same time, which is the point I was trying to make earlier. Similarly, the ES finds S on Monday and Tuesday way back at the early September level, and the NQ finds S at the same time but at a level which, though higher, represents S in its own chart, at 1420 (no, it doesn't reach 1420 exactly, but it does find S within that zone which formed two weeks ago between 1420 and 1440-ish.

Note also that the NQ "ranges" are much more rectangular, which makes S/R easier to see. However, if you also circle the swing points, as you've done, you see that each is finding S or R at the same time, though not in the same ways.

I may have made this less clear rather than more clear, but this is the best I can do for now. What matters to me is that they're both at important R. It's possible that they could both break through and go to the next level, which would be 32 (+/-) pts for the NQ and 13 (+/-) for the ES, or about 2.5:1, which is the normal ratio. Therefore, unless we just rest here for two or three days, we'll have to be open to moves in either direction.
 
"Excellent idea. If I may make a suggestion, tho, using TLs with something that trades"

TL? - please. Trend Line ??
 
Top