The Baptist
Established member
- Messages
- 715
- Likes
- 45
I am verging on a number of what I believe High Probability Trades:
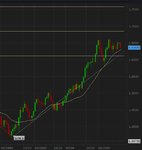
Long GBPUSD on a Break Out over next few days - current 1.6459 (likely to be off Monday/Tuesday before BO?) see chart of expected price action
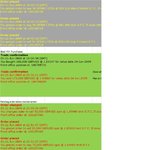
Short S&P500 on a stop entry 899 - current - 920.9 (time for this to fill still)
Short SoyBean Meal July - Have been short for awhile but believe early gains are small percentage of fall due.
My view is that a large relief rally is tiring and both Commodities and Shares will tank.
I am also short QMN9 - NYMEX miNY Light Sweet Crude Oil, Jul 2009 from 71.90
On the commodities & S&P side this is a counter trend trade, I rarely do these, but the speed of relief rally is likely to deliver a substantial and fast move south as fear reasserts..
Which will set up the biggest of the uplegs (2nd upleg is always better).
Just put up the GBP chart up as it is the most immediate
In my view the GBP has not yet broken out. however it is a highly advanced pattern.
I had a long GBPUSD, but as I still expect a retracement, I closed this and pegged a buy stop point below current action to get a better fill.
The risk is that I miss the BO. Previously I have always biased to be in and ruined Risk reward ratio on drawdown.
I have decided where market action has not completed I will rather miss a few BO trades and rather nail the ones that behave as expected.
I have also placed Short stop entry orders on the S&P as detailed above below 899.9


