You are using an out of date browser. It may not display this or other websites correctly.
You should upgrade or use an alternative browser.
You should upgrade or use an alternative browser.
- Status
- Not open for further replies.

dbphoenix
Guest Author
- Messages
- 6,954
- Likes
- 1,266
I understand that the idea of characterizing a market is foreign to most beginners, but as I watch so many people waste so much money, I'm obliged to go into this again as if one has little to no idea how his instrument behaves, his trades become essentially random ("guess and hope"). This situation is made worse if the trader has no plan (at least with a plan he'll get stopped out a lot, preferably at breakeven).
So, an excerpt from Trading By Price:
To "characterize" a market means to determine the characteristics or behaviors of the traders engaged in that market. Since a price is the result of a transaction between a buyer and seller, it is more productive to attempt to understand the unique buying and selling behaviors of these participants than to engage in gurubabble about "price behavior" (yes, I know, I'm guilty of this myself due to the shorthand made possible by what appear to be little cheats but which are more mnemonics, much like a chef will instruct the student to "prepare a mirepoix"* rather than go through detailed instructions every time he gives the order). After 100 pages, I know that you know that I know that price behaves as it does because of what traders do. And now you know that I know that you know that I know.
*a finely-diced mix of carrots, onions, and celery, used as the seasoning base for a meat dish or sauce.
While nearly all hobbyists resort to mathematical TinkerToys like indicators and formulas and others look for "fanciful shapes", professionals focus on traders and their behavior. When, for example, they see a "double top", they don't think "Ah, a double top" but rather "Hmm, sellers ran out of buyers". The first and probably most important step is therefore to think in terms of trader behavior for it is that, not TinkerToys, that moves price.In 1936, British economist John Maynard Keynes gave the best description of the stock market I've ever heard. He said stock market investors are like judges in a beauty contest. But the idea of this beauty contest is not to pick the prettiest girl, but rather to pick the girl that all other judges will think is the prettiest.
This simple metaphor is profound because it reveals the truth: For all of our study of the economy and companies, it is subjective perception – not objective reality – that sets stock prices.
And it's perplexing because, as Keynes pointed out, all of the judges are fully aware of the true nature of the contest and act accordingly. Each judge knows that he's a player in an fabulously complex game of psych and double-psych, an infinite regress of figuring out what the other guy is thinking you're thinking he's thinking you're thinking he's thinking, and so on and so on . . .
–Don Luskin
The second step is to begin the characterization process, part of which is cut-and-dried and part of which requires a certain sensitivity to behavioral dynamics, particularly the dynamics of fear (fear of making the wrong decision, fear of losing money, fear of missing out, fear of holding too long, fear of not holding long enough, fear of being tricked, fear of being trapped, fear of being blind-sided, etc, etc, etc). But regardless of which aspect may appear to be more important at any given time or interval, it is absolutely essential that meticulous records be kept. Without that, you may as well save yourself the time and effort. Trading for a living is not for you.This simple metaphor is profound because it reveals the truth: For all of our study of the economy and companies, it is subjective perception – not objective reality – that sets stock prices.
And it's perplexing because, as Keynes pointed out, all of the judges are fully aware of the true nature of the contest and act accordingly. Each judge knows that he's a player in an fabulously complex game of psych and double-psych, an infinite regress of figuring out what the other guy is thinking you're thinking he's thinking you're thinking he's thinking, and so on and so on . . .
–Don Luskin
dbphoenix
Guest Author
- Messages
- 6,954
- Likes
- 1,266
If you're prepared to create and maintain these records, the next step is to observe your market during whatever timeframe is of interest. If beginning with a day, how does your market behave overnight? Is it flat and listless? Or does it provide clues as to where buyers and sellers may be found? If there is a pre-market report coming up, do traders anticipate the results or do they lie in wait? Are certain levels tested repeatedly? Broken? Reset? Are prices trending upward or downward? What are the extents and durations of the waves? Does the pace change at any point? In what way? What effect does the change have on price movement? Are any nearby previous levels of supply or demand probed and tested? How? What is the result?
At the open, does price spike or plunge, providing no opportunity for entry other than a market order? Is there an opportunity to enter before the "open"? How high or low do these moves go? How long do they last? What are the qualitative and quantitative differences between the first 10 minutes and the second 10 minutes? The third 10 minutes? How "emotional" is all of this? When does trading settle down? What is the breadth of the opening range? If there is an economic report due out at 1000, how does price behave in anticipation of it? Do traders appear to wait for it? Is there a line beyond which they will not go? How does it behave after the report is released? How does it react to earnings reports? How does it react to unanticipated news events?
How long is trading active? An hour? Ninety minutes? Two hours? At what point does activity begin to trail off? At what time does it begin to pick up again? 1300? 1400? 1430? How does it behave at the "close"? How does it behave as it drifts into the evening and the overnight? Does foreign trading become active? Or does the market go to sleep?
Looking back on the day, does the market trend with any sort of pattern or is it seemingly chaotic? If it trends, is it mean-reverting? Does it spend more time trending or ranging? If and when it trends, how deep are the retracements? Do the bars overlap a great deal or are the trending moves "clean"? Are the ranges wide enough to permit a retracement tactic or must one trade reversals at the limits? Are the limits easily definable? Are the trend channels stable enough and long-lasting enough to be tradeable? Do they provide easily definable limits or must one make his decisions according to how far price travels from the mean? At what levels do sellers run out of buyers? At what levels are buyers able to force sellers to meet their price? At what levels are most contracts traded (incorporating a T&S display or plotting Volume At Price will help here). How does price react to those limit levels suggested by AMT?
What are the cost-benefit implications of all these trending/ranging movements for scaling in or scaling out? What are the relative risks attending to one or the other? How can one orchestrate scaling-in or scaling-out tactics to obtain the best cost-benefit ratio while minimizing risk?1
dbphoenix
Guest Author
- Messages
- 6,954
- Likes
- 1,266
IF you can maintain meticulous records and IF you are diligent in reviewing these records every day, THEN you can BEGIN to cobble together a set of strategies and tactics that you hypothesize will exploit the behaviors that you found during your observations. Much of these have been done for you through the SLA and AMT. However, the SLA and AMT do not relieve you of the responsibility for pouring over your day's records every evening and preparing a plan of action for the following day. If you do not do this every day, you may as well not trade at all on those days when you just didn't feel like doing the work. You'll not only be throwing away your money but you'll be setting yourself back. Never forget that professionals are doing all this work. If you're not, and you can't properly characterize your market and anticipate the most probable moves (see AMT again), then you're not prepared. If on the other hand you are able and willing to maintain these records and review your trades after each and every trading session, there is every possibility – given how few people go through this procedure – that you will find something that nobody else sees and take advantage of it while everybody else is standing around wondering what just happened.
With regard to prediction vs expectation vs anticipation, hobbyists who don't understand trader behavior, much less how to characterize their markets, call these debates "semantics". They see no difference between prediction and anticipation. Those who have gone through the characterization process, however, understand the difference quite well. They understand that AMT, for example, provides the expectation that price will reverse at the upper limit of a trend channel and one can anticipate, based on his work, that price will do so. Can he predict that price will reach a specific price at that upper limit? No. Can he observe the behavior of other traders to see what they do as price approaches that level and act accordingly even though price begins to stall just ahead of it or overshoots it a bit? Of course. Can he then postulate the level to which price will fall based on the principles of AMT? Yes. And when price reaches that level, will onlookers be amazed, convinced that he is a wizard, a genius, a seer? Depends on how easily the onlookers are amazed.
But none of this has anything to do with precognitive abilities or tea leaves or crystal balls. It's simply a matter of doing the prep. Those who don't do it will understandably be impressed, just as those in the audience who know nothing about magic tricks will be amazed and delighted when Presto pulls a rabbit out of his hat.
The average man does not like uncertainties. He is not trained to cope with them. He will try to “sweep them under the rug.” He will use any device that will make it possible for him to feel “more sure,” for he is not willing to accept a “maybe” or an “I don’t know” as an answer.
And so he will resort to averages, to market indicators, to complicated charts of intersecting lines designed to prove that “it” is either a Bull Market or a Bear Market. He will accept almost any kind of nonsense if it is stated with enough assurance. He will buy horoscopes to determine the trend of the market by the position of the planets. If all else fails, he will look for some authority who will relieve him of using his own intelligence, by making the either/or decisions for him. But he must have a straight, simple answer; otherwise it means nothing to him.
Do you see how this way of looking at things is out of line with the facts? Do you see how it leads, inevitably, to frustration, anxiety, and demoralization? It is asking too much of reality. It is setting up a make-believe world, and then crying if the world isn’t exactly like the make-believe.
We know, for instance, that trees “in general” are round. But you have seen tree trunks distorted by a cramped location, or by the trunks of adjacent trees, that are not round at all. It is useful to know that “tree trunks are round,” only so long as we understand that this is an abstraction, and the reality in any particular case has to be looked at, and if it is not round, that is that; the territory is the final answer, not our “map.”
–John Magee
Mapping that territory is what characterization is all about. The more distant the trader is from it, the more likely he is to make errors, to miscalculate, to remain out of touch. But when he begins to slow down, to observe, to wonder, to postulate, to test and verify, he begins to understand all the many-varied features of the territory, not someone's map of it. At this level, he is prepared to whup some posterior.And so he will resort to averages, to market indicators, to complicated charts of intersecting lines designed to prove that “it” is either a Bull Market or a Bear Market. He will accept almost any kind of nonsense if it is stated with enough assurance. He will buy horoscopes to determine the trend of the market by the position of the planets. If all else fails, he will look for some authority who will relieve him of using his own intelligence, by making the either/or decisions for him. But he must have a straight, simple answer; otherwise it means nothing to him.
Do you see how this way of looking at things is out of line with the facts? Do you see how it leads, inevitably, to frustration, anxiety, and demoralization? It is asking too much of reality. It is setting up a make-believe world, and then crying if the world isn’t exactly like the make-believe.
We know, for instance, that trees “in general” are round. But you have seen tree trunks distorted by a cramped location, or by the trunks of adjacent trees, that are not round at all. It is useful to know that “tree trunks are round,” only so long as we understand that this is an abstraction, and the reality in any particular case has to be looked at, and if it is not round, that is that; the territory is the final answer, not our “map.”
–John Magee
barjon
Legendary member
- Messages
- 10,752
- Likes
- 1,863
db
The trouble with trying to think like other traders is that one is confronted by so many different agendas by different bodies of traders, often with conflicting objectives. Similarly it is often the case that "traders" are not their own masters and must act contrary to their own thinking and wishes. Eg: if the stupid public persist in putting money into a fund then the fund manager must buy regardless of their own wish to be selling everything they've got.
So isn't it about thinking of which body of traders is holding sway at any particular moment and given that difficulty why not think of a double top as a double top and trade it as such until you are proved wrong?
dbphoenix
Guest Author
- Messages
- 6,954
- Likes
- 1,266
db
The trouble with trying to think like other traders is that one is confronted by so many different agendas by different bodies of traders, often with conflicting objectives. Similarly it is often the case that "traders" are not their own masters and must act contrary to their own thinking and wishes. Eg: if the stupid public persist in putting money into a fund then the fund manager must buy regardless of their own wish to be selling everything they've got.
So isn't it about thinking of which body of traders is holding sway at any particular moment and given that difficulty why not think of a double top as a double top and trade it as such until you are proved wrong?
http://www.trade2win.com/boards/trading-journals/209844-slayers-notes-24.html#post2659932
barjon
Legendary member
- Messages
- 10,752
- Likes
- 1,863
Yes, I recall that which seems to reinforce the point I was trying to make. In any event it's made by every transaction where there is always someone else on the other side of the trade. Not necessarily a wholly contrary view, of course - (I'm selling because I need the cash for my divorce settlement, not because I think it's going down).
I find it very difficult to think in terms of traders. I just work on my experience which says that if price does "x" there's a good chance it'll be followed by "y". Doesn't SLA do the same?
Certainl, instruments have their own characteristics, shares particularly. Some, for example, are very gappy with all the decent moves coming via opening gaps so anyone averse to holding overnight is never going to make a dime. Once again it is experience of the instrument(s) you trade that is important.
dbphoenix
Guest Author
- Messages
- 6,954
- Likes
- 1,266
It's not a question of "someone else" but of who the someone else is, in this case those who have the money to move markets. The "good chance" becomes a better chance if one is trading in concert with these traders. The SLA becomes a powerful method if one incorporates this knowledge into his trading. Otherwise it's just trading lines. If you refer to the examples in your book beginning with p. 92, you may better understand what I mean.
As for experience with the instrument, yes. But unless one takes the time to characterize whatever it is he's interested in, that experience may take years to accrue, during which time the trader stands to lose a lot of money.
There are hundreds if not thousands of "double tops" (ditto double bottoms, lower highs, higher lows . . . ) in every trading session in multiple bar intervals across multiple trading instruments all over the world. If one were to take all of them, he'd soon be broke. Knowing what The Money is looking at and acting upon is a useful filter, enabling the trader to take only those trades which are most likely to succeed.
Last edited:
dbphoenix
Guest Author
- Messages
- 6,954
- Likes
- 1,266
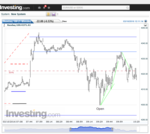
With regard to characterizing a market (see posts 82-84, above), I posted the following to the Wyckoff thread as it illustrates what he suggests with regard to determining context in preparation for the upcoming trading session. A number of things to which he calls attention -- such as closely-spaced closes -- are illustrated by this series of charts, from daily to hourly to intraday. But without characterizing the market, it is unlikely that the trader would even know what to look for, much less go on to determining the context.
The characteristics of any given market may be similar to those of other markets, but each market also tends toward the unique due to their compositions. The subject of these charts is the NQ.
The characteristics of any given market may be similar to those of other markets, but each market also tends toward the unique due to their compositions. The subject of these charts is the NQ.
Attachments
Characterization of Nasdaq 100
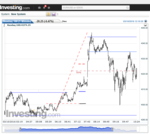
Overnight, most of the time price were in a TR (till 07:00). The most important resistance were found at the top of the second TR (blue hourly chart). Level 4308 was tested repeatedly and has been broken to the upside. When this level has been broken, price moved higher. The pace and length has changed and price was able to move faster. After 30 min (07:45) of hesitation there were a huge portion of demand, which has changed price dramatically and has been exhausted at 4345 level. As I see this demand was produced by news "Unemployment claims". Price has been moving higher before this news, so some traders were quietly buying (they even were able to penetrate TR to the upside). On the top of this advance there has been TR out of which price moved lower (08:52). It has hesitated near 50% level (08:58-09:10) of a previous upward move and continued its trip lower until it has reached the top of previous overnight TR (blue) (09:13). Then we saw demand there, which was able to move price not higher than 50% level of the up move (09:20). Before the open bell price went lower with great acceleration and met demand at the 50% middle of an overnight TR (09:30). This was the third attempt to push price lower since the brake of a TR.
Price has spiked to the 4300 level and went higher without providing an entry point. There were no opportunity to enter before the open. During the first 10 minutes price has bounced of the TR middle and tried to reach middle of advance with 2 attempts. Pace of this two up waves were pretty well accelerated. I guess traders were feeling that price can go away from them. Fear to miss opportunity?! During the next 10 min price met support at 4310 (09:41), hesitated, has tested this support (09:47)and has pushed up. When price has approached middle of previous advance (09:50), it has hesitated there for 5 min and went higher with less enthusiasm. Before price has reached previous TR it has hesitated for 5 min again, then tried to go higher(10:02), but were unable to continue rising. Price has reversed, tested small TR (10:08) and went lower.
To be continued...
Attachments
Last edited:
dbphoenix
Guest Author
- Messages
- 6,954
- Likes
- 1,266
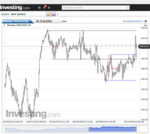
Overnight, most of the time price were in a TR (till 07:00). The most important resistance were found at the top of the second TR (blue hourly chart). Level 4308 was tested repeatedly and has been broken to the upside. When this level has been broken, price moved higher. The pace and length has changed and price was able to move faster. After 30 min (07:45) of hesitation there were a huge portion of demand, which has changed price dramatically and has been exhausted at 4345 level. As I see this demand was produced by news "Unemployment claims". Price has been moving higher before this news, so some traders were quietly buying (they even were able to penetrate TR to the upside). On the top of this advance there has been TR out of which price moved lower (08:52). It has hesitated near 50% level (08:58-09:10) of a previous upward move and continued its trip lower until it has reached the top of previous overnight TR (blue) (09:13). Then we saw demand there, which was able to move price not higher than 50% level of the up move (09:20). Before the open bell price went lower with great acceleration and met demand at the 50% middle of an overnight TR (09:30). This was the third attempt to push price lower since the brake of a TR.
Price has spiked to the 4300 level and went higher without providing an entry point. There were no opportunity to enter before the open. During the first 10 minutes price has bounced of the TR middle and tried to reach middle of advance with 2 attempts. Pace of this two up waves were pretty well accelerated. I guess traders were feeling that price can go away from them. Fear to miss opportunity?! During the next 10 min price met support at 4310 (09:41), hesitated, has tested this support (09:47)and has pushed up. When price has approached middle of previous advance (09:50), it has hesitated there for 5 min and went higher with less enthusiasm. Before price has reached previous TR it has hesitated for 5 min again, then tried to go higher(10:02), but were unable to continue rising. Price has reversed, tested small TR (10:08) and went lower.
To be continued...
This is a good example of "telling the story" that I refer to in the book. Whether right or wrong or accurate or inaccurate is not so important as doing it. This is the beginning of observation, not just checking in now and then to "see how price is doing." As to its place in characterization, it is a necessary component, but thorough characterization takes at least a year (250 trading days, about two months via replay). It's not something that losing traders are going to do.
There are some differences between what you saw and what I saw, which I've annotated in your charts. But I do want to point out that there is ALWAYS an entry, whether before the "open" or not. The NQ trades 24/5. One can trade whenever he feels like it.
This particular series also illustrates the irrelevance of news, much less what the news is or where it's coming from. Therefore there's no reason to follow it. To the contrary, there is a good reason NOT to follow it as knowing what the news is may and probably will bias the trader toward a "bullish" or "bearish" stance, and neither is appropriate. Or necessary.
Db
Attachments
Overnight, most of the time price were in a TR (till 07:00). The most important resistance were found at the top of the second TR (blue hourly chart). Level 4308 was tested repeatedly and has been broken to the upside.
...
...
When price has approached middle of previous advance (09:50), it has hesitated there for 5 min and went higher with less enthusiasm. Before price has reached previous TR it has hesitated for 5 min again, then tried to go higher(10:02), but were unable to continue rising. Price has reversed, tested small TR (10:08) and went lower.
To be continued...
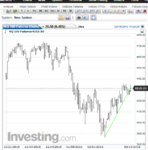
Price were active 2 hours after the open. Then it was ranging for an hour. Starts again at 12:20. Trails off at 13:00. Starts again at 14:00 till 15:00. At the close period, price were less active, more ranging than trending.
During this session it was better to use SLA method, rather AMT. Most of the time, retracements are not more than 50% or less, unless trend is not reversing. When price is in a trending period, bars within waves are not overlap a great deal. Trend channels are long lasting enough and they are tradable. Trend channels provides easily definable limits. (Db, will you give me link, where I can read more about "to make decisions according to how far price travels from the mean" thank you!)
Sellers can be seen at 4285 level and buyers can be seen at 4230-4240 and 4260-4270.

This is a good example of "telling the story" that I refer to in the book. Whether right or wrong or accurate or inaccurate is not so important as doing it. This is the beginning of observation, not just checking in now and then to "see how price is doing." As to its place in characterization, it is a necessary component, but thorough characterization takes at least a year (250 trading days, about two months via replay). It's not something that losing traders are going to do.
There are some differences between what you saw and what I saw, which I've annotated in your charts. But I do want to point out that there is ALWAYS an entry, whether before the "open" or not. The NQ trades 24/5. One can trade whenever he feels like it.
This particular series also illustrates the irrelevance of news, much less what the news is or where it's coming from. Therefore there's no reason to follow it. To the contrary, there is a good reason NOT to follow it as knowing what the news is may and probably will bias the trader toward a "bullish" or "bearish" stance, and neither is appropriate. Or necessary.
Db
Thats hard, very hard. It takes me most of my day time to tell this small story. I hope it will be easier some day. Or may be I need just to pay attention to some specific areas. Anyway, its possible! :rambo:
Thats will be harder to characterize about 100 NYSE stocks 😱
dbphoenix
Guest Author
- Messages
- 6,954
- Likes
- 1,266
Price were active 2 hours after the open. Then it was ranging for an hour. Starts again at 12:20. Trails off at 13:00. Starts again at 14:00 till 15:00. At the close period, price were less active, more ranging than trending.
During this session it was better to use SLA method, rather AMT. Most of the time, retracements are not more than 50% or less, unless trend is not reversing. When price is in a trending period, bars within waves are not overlap a great deal. Trend channels are long lasting enough and they are tradable. Trend channels provides easily definable limits. (Db, will you give me link, where I can read more about "to make decisions according to how far price travels from the mean" thank you!)
Sellers can be seen at 4285 level and buyers can be seen at 4230-4240 and 4260-4270.
Actually prices were active from 0300NYT on, making the NQ ideal for both Western and Central Europe.
As for these trades, I assume you're doing this in hindsight, and hindsight analysis is of value only to the individual trader as what is done depends almost entirely on the individual's risk tolerance: the greater the tolerance, the fewer trades, the less tolerance, the more trades. Most traders are afraid of trading so they will trade very tight. The characterization process helps to alleviate this fear.
As for making decisions according to how far price travels from the mean, those aren't relevant to intraday trading. The initial trade is taken off the weekly channel. See p.52 in your book. And try to read the book before you do too much more trading.
Db
dbphoenix
Guest Author
- Messages
- 6,954
- Likes
- 1,266
Thats hard, very hard. It takes me most of my day time to tell this small story. I hope it will be easier some day. Or may be I need just to pay attention to some specific areas. Anyway, its possible! :rambo:
Thats will be harder to characterize about 100 NYSE stocks 😱
You shouldn't be trading at all until it's done. But that's your choice.
Perhaps all of this should be in your journal.
Db
piphoe
Legendary member
- Messages
- 10,038
- Likes
- 196
What do those red marks signify, trades? If they do why not make your entry and exit more explicit? Not a criticism, only a question. I ask because I'm confused.
barjon
Legendary member
- Messages
- 10,752
- Likes
- 1,863
What do those red marks signify, trades? If they do why not make your entry and exit more explicit? Not a criticism, only a question. I ask because I'm confused.
If you click on DbP's signature then download and read the SLA pdf then your confusion will clear like the morning mist 🙂 (Oh, and you will find that following the rules prevent you being "torn to pieces" as you opine in another thread 😆
- Status
- Not open for further replies.