Please clarify - when you refer to the 12th above do you mean 12-Jan or 12-Feb? I think when you say week of 25th you refer to Jan-25th. In lieu of volume figures is activity determined by the increase in difference between the daily high and low?
Jan 12. By the following week, it's all over. Volume is necessary to determine activity unless one is watching price move. But no one but daytraders are going to be doing that. One can have an increase in difference between daily highs and lows with no increase in activity at all. An increase in the difference simply means an increase in disagreement.
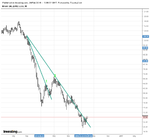
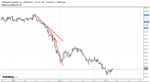
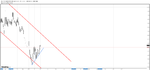
The RET is not confirmed because a higher high was not made. after 2-Feb price advanced toward LSH but supply prevented it advancing - does this indicate supply was not exhausted on the 20-Jan? In which case wouldn't one have anticipated a need to draw a SL one the DL was broken? [the DL on the chart was between 20-Jan and 26-Jan extended upwards]
The rally is called a "technical" rally, usually consisting of at least some short-covering. In order to determine whether or not the buying was "real", one must see how price behaves after the test. If there's genuine interest, price will rise; if not, it will fall and generally make a lower low. However, price has to get past the swing high of the technical rally. If it doesn't, then you're looking forward to ranging. All this is explained in Wyckoff's analysis of the NYT Average.
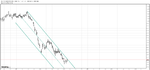
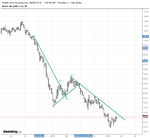
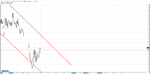
If I'm confident the 20-Jan low was the climatic low and buyers are in charge now. If I see price fail to make a higher high after the first test then I should expect another test - assuming there is still resistance from supply. 9-Feb sees price fall considerably through the LSL and close near the low of the day. The next higher swing low after 20-Jan is 26-Jan. If price holds above that point then could the test be considered real? If trading the daily a long position could be entered above the 9-Feb swing low with a stop at 26-Jan swing low price?
As long as price holds above the climax low, the test was good. However, that doesn't mean a V reversal. Given the decline in price, one can expect a lengthy bottoming process, as with the market in '09. As for the Feb swing low, I show that taking place on the 11th, but, yes, one could take the long off the daily at that point. Where you put your stop will depend on what price has to do to prove you wrong. If it makes a lower swing low, i.e., lower than the 11th, I should think that would be sufficient. Otherwise, a stop below the climax low. Depends on your risk tolerance.
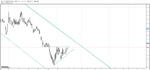
I'm honestly not sure how to transition from the daily to hourly charts to find an entry. My assumption would be to use the daily to find reasonable entry prices as I have read what you write about key market participants and big players paying attention to daily high/lows. Keep in mind the daily LOLR is up and find a corresponding situation on the hourly?
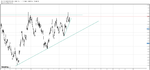
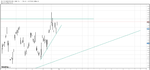
Find the trading opportunities off the weekly. When you see what you think may be one, switch to the daily. In this case, the oversold condition in January constitutes a potential trading opportunity. And if you consult an hourly chart, you'll also see a higher low at that point. Trading opportunities aren't addressed in detail in the pdf. There's more on them in the book. However, it should be clear that any bounce off a trend channel should be viewed as a trading opportunity, as would be a bounce off the upper or lower limit of a range. These are shown in the pdf.
I think it might be better for me to continue to read about analysing the market price and volume information from Wyckoff and your own material before thinking about making entries? Unless you think otherwise. I'm happy to go slow and steady.