How To Read a 15 Minute Chart

mechanicaldaytrader

Active member
Messages
189
Likes
7
I'm stuck between airports today, the internet is working fine, so I'm going to freely present some trading methodologies I've used and demonstrate how these methods work on a 100% technical chart. Stop losses are less than $50 and profit objectives are $200 to $500 per trade (hopefully!).

This thread is to demonstrate how to use a 15 minute Candlestick chart to trade most every significant reversal within the EMINI DOW ($5 contract). All the information given in this thread by me is "free" - you are free to use these lessons to help and improve your trading style.

Applying it to anything other than the EMINI DOW $5 contract is beyond the scope of my teaching, however. Any/all comments need to pertain to the EMINI DOW $5 contract, no other markets will be discussed in this thread by me.

Here are the resources used in this technical analysis;

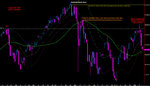
Platform = Tradestation 8.7 using "candlestick with trend" style format
Magenta bars are time periods controlled by sellers
Cyan bars are time periods controlled by buyers

proprietary KEY REVERSAL15 showme draws the following plots

cyan line = short covering/long entry if coequal or rising

yellow line = long profits/short entry if coequal or descending

green line/support = used as a support line, current rising prices in an uptrend will support the current higher line, with retracements in the future expected to previous lower line.

greenline/resistance = if rising yellow line is coequal to a previous green line (that has subsequently descended), this is a likely short entry, exiting longs is suggested, since this is a retracement of old support.

red circle = highest high is plotting, be prepared to take long profits if in an uptrend; if in downtrend, likely initiate short entry

cyan circle = lowest low is plotting, opposite logic of red circle

orange rectangle = signifies that resistance is peaking, uptrends will punch through this resistance, downtrends will fall away from this plot.

How this dang thing works:

First, determine the Dow market condition;
  1. Uptrend
  2. Downtrend
  3. Trading Range following Uptrend
  4. Trading Range following Downtrend

Next, understand that the Dow trends multiple numbers of days in one direction or it is in a trading range following a Trend.

Trends have upward cycles of bars, featuring partial retracements downward followed by 100+% retracements upward; opposite logic for downtrends.

Trading Ranges careen back and forth between existing or preexisting yellow, cyan and green lines. You're either entering/exiting at 100% retracements, 100%+ retracements or less than 100% retracements of pre-existing support/resistance.

THUS - Your entries and exits are entirely dependent on knowing what the condition of the market is.

Simple Uptrend Rule:
Cyan line rises, buy, stop loss is one tick below the cyan circle.
Market should rise within 'x' number of minutes to the present yellow line; consider taking profits at any occurrence of the red circle; understanding that the Dow will typically try for a 100% retracement of a previous yellow line of the current or previous day(s).

Simple Downtrend Rule:
Opposite logic of Simple Uptrend Rule, using the Yellow line instead of the Cyan line as the basis of decision making.

Trading Range Rule:
First, determine if the Trading Range is following a Uptrend or a Downtrend;
Second, determine your bias (based on the Dow Cash daily chart and overall reading of the past week of the 15 minute futures.

In overbought markets, buy retracements of overbought highs (coequal, descending yellow)
In oversold markets, buy retracements of oversold lows (coequal, rising cyan).

Obviously in trading range markets a more precise chart is required for proficient entry/exit, that would be the one minute charting programs I use. If there's interest I can go there, time permitting.

THREAD GOAL:
I will demonstrate that low risk entries can be taken near 100% retracements of yellow, cyan and green in trading range markets.

I will demonstrate that low risk long entries can be taken near rising cyan lines or 100% retracements of a previous cyan line 'x' days before.

I will demonstrate that low risk short entries can be taken near descending yellow lines or 100% retracements of a previous yellow line 'x' days before.

APPLICATION OF TRADING METHOLOLOGY:
Tradestation has 2 years of data at any given time on it's server; for now, year 2010 will be the basis of my thread presentation.

Future posts:
I will show a simple multiple day uptrend and how the KEY REVERSAL15 program typically captures low risk reversals up.

I will show a simple multiple day downtrend and how the KEY REVERSAL15 program typically captures low risk reversals down.

If there's interest and time, I'll delve into the typical Dow Trading Ranges - this is where most folks lose money - the KEY REVERSAL15 does simplify things and there are typically one or two trades every day in trading range markets just based on the 15 minute analysis.

MechanicalTrader
 
UPTRENDS - How To Read a 15 Minute Chart

ok, let's look at the graphic;

Uptrends must create higher highs each day
coequal or rising cyan plots must stop downward retracements followed by a robust movement upward.

What days met these rules?
7/8
7/9
7/12

7/13...no trade entry and notice the sell off at the end of the day...

7/14 AM...bought the rising cyan, however, the market only reached R2 (created on 7/13)

7/14 PM ....notice the rising cyan in the afternoon failed to support the market, thus the market condition has changed, we're no longer in an uptrend. Yellow line descended near the end of the day, and sold off significantly to the following day.

7/15 PM....daily low is a retracement of resistance on 7/12...following a faltering Uptrend this is the last refuge of long entries. Use the descending green line and notice that is a 100% retracement of the market close of 7/12 - since this is untouched and we understand that the closing price of any day during a trend is critical, this is a the basis for taking a long entry @ the low green line - it fits our view of a low risk 100% retracement.

7/15 PM...later...cyan rises above your first long entry @ green, you add more contracts at the rising cyan line at exit at the 100% retracement of the previous day's yellow. Notice the market sells off from this retracement and notice the huge gap down the following day.

Simple charting, simple rules, it does take some skill to understand market conditions; almost always one or two trades every day.

Mechanical Trader
 

Attachments

  • uptrend market condition using key reversal post #2.jpg
    uptrend market condition using key reversal post #2.jpg
    139.9 KB · Views: 797
Uptrends -analysis of post #2

attached is the same chart as included in post #2, except with trading analysis.

Overbought market conditions are sold (coequal/descending yellow lines when the market condition is a trading range or a likely retrace down to a elevated cyan line (see 7/8). Recommended short entries (and long profit exits) are highlighted with Purple arrows.

Ovesold market conditions are bought (coequal/ascending cyan lines when the market condition is a uptrend or a trading range within a uptrend are highlighted with White arrows.

Notice how the market falls from the high green line and rises from the descending green line - this is indicative of trading ranges - when the market is in a trading range (not trending) you will use the Green line often, during trends it is largely ignored. The math of the green line is controlled by variables within a market condition, whereas cyan and yellow lines are controlled by price behavior.

If you have questions, don't hesitate to ask, when I have time, I'll check in and post replies, so there might be some gap in time before I get back to you.

Mechanical 'Trader
 

Attachments

  • uptrend market condition using key reversal post #3.jpg
    uptrend market condition using key reversal post #3.jpg
    148.6 KB · Views: 591
Re: Uptrends -analysis of post #2

Nice looking charts, but I say the proof is in the pudding (nice cliche). It is one thing to look in the rearview mirror to see all the great bounces off of certain S&R points. It is another to post actual live trades based on the methodology you are selling. Can you post some trades? I think this is fair for all that are looking on, and of whom may consider your service.
Just another point. I have an outstanding set of proprietary set of S&R's. I can, at the end of that period of time--weekly, monthly, and yearly-- show some excellent bounces and reactions at those points, but I haven't really proven anything in spite of the exceptionalaility of my S&R's. It's the live trades that turns them into the realism they produce.


attached is the same chart as included in post #2, except with trading analysis.

Overbought market conditions are sold (coequal/descending yellow lines when the market condition is a trading range or a likely retrace down to a elevated cyan line (see 7/8). Recommended short entries (and long profit exits) are highlighted with Purple arrows.

Ovesold market conditions are bought (coequal/ascending cyan lines when the market condition is a uptrend or a trading range within a uptrend are highlighted with White arrows.

Notice how the market falls from the high green line and rises from the descending green line - this is indicative of trading ranges - when the market is in a trading range (not trending) you will use the Green line often, during trends it is largely ignored. The math of the green line is controlled by variables within a market condition, whereas cyan and yellow lines are controlled by price behavior.

If you have questions, don't hesitate to ask, when I have time, I'll check in and post replies, so there might be some gap in time before I get back to you.

Mechanical 'Trader
 
Determing the Multiple Day Market Condition

The Dow Cash Index is used for the most objective view of the market; the EMINI DOW will merely reflect the overbought and oversold aspects of the Dow Cash. I only look at the daily bars of the Cash, lots of traders like to use the 15 min and 60 min - that's fine for them and their longer term strategies.

Here's a snapshot of the the Dow Cash daily bars in mid August. There is a rather cataclysmic Head & Shoulders formation that is obvious - so the current view is to aggressively sell overbought market highs. Since the market has now descended to a support level (lower Keltner/moving average), you can expect some short covering at new daily lows followed by rapid retracements upward.

Here's the market condition rules for the daily chart, which really helps understanding what the market condition is when looking at the 15 minute (that's why I've included this chart).

Uptrends retrace to the rising Low-K, stop, reverse upward and set higher highs. Extremely powerful rallies (never short these) only retrace to the Mid-K then go higher.

Downtrends do the opposite of a descending High-K and Mid-K.

Trading Ranges are either WITHIN the High-K and Low-K or violate these levels. When they occur WITHIN, this is typically a trading range WITHIN A TREND, stay with the Trend!

When they occur OUTSIDE of the High-K, Low-K, this is indicative of a trading range that is either setting higher lows or lower lows. Pay attention to the violations of the High-K and Low-K during this market behavior - whatever the direction intraday, look for profit taking/short entries near the top yellows when near the daily bar is violating the High-K and the opposite for price behavior by the Low-K. ...this is the hardest part of trading, since the reversals are significant and violent (fast). During these market conditions, ten tick stops are used and trades are taken based on my 1 minute charts.

Mechanical Trader
 

Attachments

  • dow cash head & shoulders summer 2010.jpg
    dow cash head & shoulders summer 2010.jpg
    278.1 KB · Views: 747
.....free....duh....

The KEY REVERSAL15 showme will run on your Tradestation platform - you'll need to subscribe to the data, which is the CBOT EMINI INDEX futures ($10 per month for real time).

If you have those current resources on your PC, you can contact me and I will send the encrypted showme out for free for a limited trial. You tell me how many days you want it and I'll program it that way. You can then replicate the trades going back 2 years on Tradestation data, and apply the rules for understanding market conditions. This market reverses on the 15 minute bar behavior exclusively, so don't give me this "rear view mirror" stuff...all major reversals every single day occur based on 15 minute bar behavior. The red/cyan/white dots are real time (as well as the lines) and then you have (typically) several minutes after the dot appears to enter/exit the market.

Using the overnight session and the day session gives multiple trades per session per day, unless the market is in an extreme trend. Once traders understand the 15 minute reversal concept, then they're ready for using the 1 minute which gives many more low risk reversals.

If you're not open minded about finding a 100% technical solution for one or two trades per day with the only discretion determined by "current market condition" then I suggest you don't subscribe to this thread.

Since there is no cost for this, this is 100% snake oil free stuff.


Mechanical Trader
 
Re: .....free....duh....

Wow! I didn't know that a few simple comments would get your ire up that much.
For one, I am not looking to your method to trade with, as I already have one that yields more trading opportunities than I know what to do with. I miss more than I'm able to trade (Just a statement of fact, not trying to impress anyone.).
My point is show us your system by posting live trades. By doing that, you convey believeability and confidence in your system. Again, I cna post charts that show perfect bounces and trend reversals off my S&R's. They look real good. But when I post real time trades, that is when they start taking on their own significance.
Snake oil free? So is all the other reading material on this site. That's all it is until some validity is proven.


The KEY REVERSAL15 showme will run on your Tradestation platform - you'll need to subscribe to the data, which is the CBOT EMINI INDEX futures ($10 per month for real time).

If you have those current resources on your PC, you can contact me and I will send the encrypted showme out for free for a limited trial. You tell me how many days you want it and I'll program it that way. You can then replicate the trades going back 2 years on Tradestation data, and apply the rules for understanding market conditions. This market reverses on the 15 minute bar behavior exclusively, so don't give me this "rear view mirror" stuff...all major reversals every single day occur based on 15 minute bar behavior. The red/cyan/white dots are real time (as well as the lines) and then you have (typically) several minutes after the dot appears to enter/exit the market.

Using the overnight session and the day session gives multiple trades per session per day, unless the market is in an extreme trend. Once traders understand the 15 minute reversal concept, then they're ready for using the 1 minute which gives many more low risk reversals.

If you're not open minded about finding a 100% technical solution for one or two trades per day with the only discretion determined by "current market condition" then I suggest you don't subscribe to this thread.

Since there is no cost for this, this is 100% snake oil free stuff.


Mechanical Trader
 
hey 4X, there's no ire in my statement, merely factually backing up what Tradestation will plot on the 15 minute chart real time.

What I present is not a system but a way of thinking that only works on one market and can be backtested ad finitum. If anyone knows of free Tradestation indicators that can be backtested with simple trading rules, please let me know, I'm all ears...none of us have arrived, I'm always willing to learn something new!

The purpose of this thread is to concisely display how knowing the market condition will lead a trader to daily profitable trades.

In this thread I have presented:
  1. how to interpet a keltner on daily bars
  2. don't trade unless you know the market condition
  3. the four market conditions
  4. display of a daily dow chart that can be easily replicated by anyone for free
  5. trading rules for uptrends
  6. trading rules for downtrends
  7. recomended stop losses
  8. recommended profit objectives
  9. all reversals occur based on 15 min bars (my thesis which may or may be accurate)
  10. lastly, an opportunity for someone to implement these above concepts for free

I'd be interesting in seeing screen prints of anyone that has programmed 100% mechanical perfect bounces, ---- if ANYONE can do this please by all means start a new thread showing said perfect bounces off of s/r levels along with the trading rules that go along with it.....Like my charts, there are ONLY two lines, one support, one resistance, the other two plots are historical (retracement) in nature. You only have to look at ONE chart and the risk/reward is known before you enter an the entry is always within 'x' minutes of the next 15 minute bar.

I'm glad there are others than can do this and am looking forward to seeing their screen prints here at T2win. By all means provide a link where I can subscribe so I can further my learning (FOR FREE!). Thanks 4X!


Mechanical Trader
 
Okay, so I'll stand corrected. It sounded that way by this comment, "If you're not open minded about finding a 100% technical solution for one or two trades per day with the only discretion determined by "current market condition" then I suggest you don't subscribe to this thread", and by your title "free...duh".
What I'm really trying to say is that your charts would be more further validated by posting live trades based on what you see, not referring someone to TS or whatever else. Most charts look great with S&R's plotted on them and showing how price reacted. Again, to prove its validity, how tradeable is it?
Believe me, I'm not trying to find fault nor stir up a hornet's nest, and maybe I did with the "ire" statement. I'm trying to challenge the viability of what we are looking at on your charts.
A free link that you want provided is in my signature. I have nothing to sell. Feel free look around. If you want, express any concern. If you want me to post a chart with my S&R's and show the beauty of them thereof, I will. Some of my trades are also posted there. If I have proper access to the chart, I'll get it, and post the S&R's--weekly, monthly, or yearly. Mine are always figured on the 1st day of the term.
BTW, those comments are not meant as a distraction to your subscribers of your thread. I'm simply addressing your comment. I wish you well.


hey 4X, there's no ire in my statement, merely factually backing up what Tradestation will plot on the 15 minute chart real time.

What I present is not a system but a way of thinking that only works on one market and can be backtested ad finitum. If anyone knows of free Tradestation indicators that can be backtested with simple trading rules, please let me know, I'm all ears...none of us have arrived, I'm always willing to learn something new!

The purpose of this thread is to concisely display how knowing the market condition will lead a trader to daily profitable trades.

In this thread I have presented:
  1. how to interpet a keltner on daily bars
  2. don't trade unless you know the market condition
  3. the four market conditions
  4. display of a daily dow chart that can be easily replicated by anyone for free
  5. trading rules for uptrends
  6. trading rules for downtrends
  7. recomended stop losses
  8. recommended profit objectives
  9. all reversals occur based on 15 min bars (my thesis which may or may be accurate)
  10. lastly, an opportunity for someone to implement these above concepts for free

I'd be interesting in seeing screen prints of anyone that has programmed 100% mechanical perfect bounces, ---- if ANYONE can do this please by all means start a new thread showing said perfect bounces off of s/r levels along with the trading rules that go along with it.....Like my charts, there are ONLY two lines, one support, one resistance, the other two plots are historical (retracement) in nature. You only have to look at ONE chart and the risk/reward is known before you enter an the entry is always within 'x' minutes of the next 15 minute bar.

I'm glad there are others than can do this and am looking forward to seeing their screen prints here at T2win. By all means provide a link where I can subscribe so I can further my learning (FOR FREE!). Thanks 4X!


Mechanical Trader
 
More 15 Charts -- July 15th to August 13th

Now that you've learned the trading rules, let's put them into practice;

Look for 100% retracements within 2 trading days (yellow to yellow [sell entry], cyan to cyan [buy entry], cyan to green [buy entry], yellow to green [sell entry]); After you've mastered finding 100% retracements, then you can learn the art of partial retracements using the one minute chart for your entry/exit.

Notice how the market tops out at previous support (yellow matches a previous cyan) then sells off - this is a standard reversal down; opposite logic for powerful reversals up.

Double Tops of Yellow should make lower lows that same day; Double Bottoms of Cyan should make higher highs the same day. If those outcomes DO NOT occur, your bias is to take trades going the other way. The Dow relentlessly reverses on previous retracement levels within one or two time perameters - this is your basis of most trading range market entries. When these outcomes are likely, look at the one minute chart and take the trade.

Here's 4 more screen prints to practice your trading rules. The starting date of each screen capture displays the appropriate date.

Mechanical Trader
 

Attachments

  • JULY 15TH KEY REVERSAL15.jpg
    JULY 15TH KEY REVERSAL15.jpg
    126.3 KB · Views: 403
  • JULY 22 KEY REVERSAL15.jpg
    JULY 22 KEY REVERSAL15.jpg
    123.9 KB · Views: 408
  • JULY 30TH  KEY REVERSAL15.jpg
    JULY 30TH KEY REVERSAL15.jpg
    125.8 KB · Views: 411
  • AUGUST 6TH KEY REVERSAL15.jpg
    AUGUST 6TH KEY REVERSAL15.jpg
    124.4 KB · Views: 322
Last edited:
Top