You are using an out of date browser. It may not display this or other websites correctly.
You should upgrade or use an alternative browser.
You should upgrade or use an alternative browser.
Hi Benji,
It depends on how you are trading. For example with stocks I place my stop just beyond the nearest suuport or resistance level. But with futures where I need to control my losses very tightly (I'm not risking more than 1% of capital on any one trade) then it's a fixed number of point stop.
You need to look at the CT manual (which I haven't seen) and decide what violates the initial premise for the trade. ie you went in because it was near support so the logical stop is if that premise is proved false ie it goes through that support.
HTH
Benji,
If you're using the CT formula you might want to look at some of the comments on the Champion Trader thread on these boards.
Particularly those about stop loss and choppy markets. Also (and I only discovered this very recently) on the CT web site he proposes a slightly different stop loss to the one promoted in the book. If you have the book you should also have access to the members area to get this information. This revised stop setting makes much more sense of the formula.
Also take note of Helequ's comment regarding money management. This is probably one of the most overlooked areas of trading success - took me a long time to even begin to understand its importance. Study this one hard!
- Messages
- 2,325
- Likes
- 17
There are two things you need to bear in mind when setting your stops:
a) before you enter the trade, work out where you will exit IF the trade goes against you. Always protect your risk and the profits will take care of themselves. Work out how much this will cost you in real money. When you are more advanced you can work this out as a percentage. Decide if you are really willing to take this loss; if not, don't enter the trade and wait for the next one.
b) position it so that when the price comes down to take out all those traders with stops, yours does not get hit along with all the others. So leave sufficient space below the 00s (£1.00, £18.00, £19.00 etc) and previous troughs in the price. Unfortunately there is no easy formula; you just need to get a feeling for where the most appropriate place is.
- Messages
- 2,325
- Likes
- 17
Many traders put their stops just below the 00s, for example at £4.95 or £4.98 or even £4.99. It is not unknown (haha) for market makers or the big boys to bring a price down to deliberately (as if!) take out the stops at these positions before the price rises again. You see it happen all the time, where in a double bottom pattern the 2nd V of the VV is slightly lower than the 1st V. This is to hit the stops before reversing into a wonderful trend upwards - the train leaves without you in other words.
So just bear this in mind - you might want to put your stops at £4.91 or £4.92 or wherever you are unlikely to be 'inadvertently' hit.
So just bear this in mind - you might want to put your stops at £4.91 or £4.92 or wherever you are unlikely to be 'inadvertently' hit.
Hi ZC,
You can best see S/R levels on a P&F chart but failing that take any chart and draw lines where the price has had problems getting through. Where it bounces off a few times. It's less of a science than an art and it depends on which timeframe you use as to what levels you will see. But if you want to be convinced that S/R works then just watch an intraday chart of something like the Dow 🙂
You can best see S/R levels on a P&F chart but failing that take any chart and draw lines where the price has had problems getting through. Where it bounces off a few times. It's less of a science than an art and it depends on which timeframe you use as to what levels you will see. But if you want to be convinced that S/R works then just watch an intraday chart of something like the Dow 🙂
Naz
Experienced member
- Messages
- 1,391
- Likes
- 25
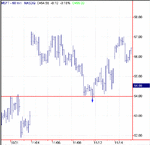
Ok guys the support line is at $54.You know that i only trade the US markets because i find them more predictable.So if i talk about anything its based on the US.
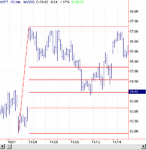
Nasdaq stocks love whole numbers and fibonacci levels(learn them if you dont already know about them).So in the Microsoft (code MSFT) example.You see that i've put a fib (fibonacci) grid on the last major move up and the 62% retracement is at $54 where suprise suprise is previous resistance.
Now everyone knows this and no doubt so do the market makers.Many of us use things called level 2 screens on the Nasdaq so we can see what the market makers are doing.They know that people will use these type of levels for stops so they run the stops.However as they take it below a support level we watch them buy up all the stock on our level 2 screens that is being dumped by traders who have their stops there and for us when the important market makers buy we buy,then hey presto up we go.
Attachments
Naz
Experienced member
- Messages
- 1,391
- Likes
- 25
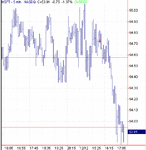
If your interested thats exactly what i'm doing now.I went short on MSFT at the red arrow and i'm watching the action underneath the whole number to decide my next move.
So for your interest .Forget the red lines i just printed it quickly.I didn't get a very good entry,but i had to live with it.My initial stop was at $54.95.I quickly tightened this up as the stock moved in my favour to breakeven.I've trailed my stop as the stock has fallen.
So for your interest .Forget the red lines i just printed it quickly.I didn't get a very good entry,but i had to live with it.My initial stop was at $54.95.I quickly tightened this up as the stock moved in my favour to breakeven.I've trailed my stop as the stock has fallen.
Attachments
Last edited:
Naz
Experienced member
- Messages
- 1,391
- Likes
- 25
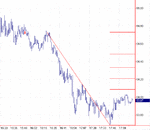
Ok i've put a fib grid over the last move down.The 38% retracement is at $54.08.So i'm going to have a break and so i've put an auto stop in my software at $54.12.If it gets taken then my total profit for the position will be 81c x 1500 shares= $1215.
For others that are interested if you notice the time of the previous post where i sold half it was the exact time of the bounce on the chart.Thats where Nasdaq level 2 screens come in so handy.
For others that are interested if you notice the time of the previous post where i sold half it was the exact time of the bounce on the chart.Thats where Nasdaq level 2 screens come in so handy.
Attachments
Last edited:


