Stochastics on Intra Day Chart

cd173

Active member
Messages
209
Likes
1
Hi All

Can anyone tell me if they use Stochastic indicators for buy and sell signals on an intraday chart. They appear to work very well as a longer term trade tool, say a couple of weeks.

Using 'The Last Stochastic Technique' of K%39 & D%1 you get very good signals when the 50% line is crossed.

Does anyone use this technique and can it be used on all time frames?

Any help greatly appreciated!

Cheers
C
 
Stocs on Intraday charts

Hi Cd,
I have used stocs on intraday charts for some time, if you want to e-mail me I will discuss it at greater length with you.
 
Hi Dax Beater

Thanks fo the offer of help.
Would you like me to pm you or external email?

Cheers
C
 
Hi Dax Beater

I've pm'ed you but if you give me your email I'll send to you external.

Cheers
Chris
 
Simon,
I replied to your e mail but the addy was rejected have you an alternate address?

Regards

Keith
 
Heres what I wrote to you Simon,

Yes Simon no problem...I'm being summoned to go shopping by she that must be obeyed so I will talk to you later

Regards

Keith
 
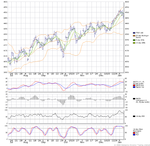
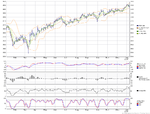
Stochastics are said to work extremely well with RSI as the RSI can filter the more frequent signals provided by the stochastics. When both offer the same signal and price confirms it then it is a good signal from intraday to daily. An example of intraday 15 min
 

Attachments

  • ftse ample 800 x 600.png
    ftse ample 800 x 600.png
    23.5 KB · Views: 1,155
An example of longer daily
 

Attachments

  • ftse ample 6 mth small.png
    ftse ample 6 mth small.png
    23.6 KB · Views: 1,001
Stochastics

You should be aware of the use of multiple stochastics (i.e based on differeent time frames:
I picked up the idea from
http://www.dacharts.com/systems.php
and speciifcally from
http://www.intellitraders.com/chartpatterns/charttemplate.html

See this for an example http://www.dacharts.org/archives/B_Line_Folder/Lt_Stoch_St_div.gif

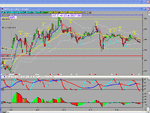
I use Slowd 38 and 13 bars as you can see in the Right hand Dax 1 min chart attached...

the longer stochastic is colour coded and show the longer trend, the short term is coded and shows moves within the trend.. when the longer is greater and 80 and the lower dips and starts to rise : it's a bounce in uptrend.. and vice versa..
 

Attachments

  • dax11dec.gif
    dax11dec.gif
    40.1 KB · Views: 1,104
Heres the trades that went wih those signals......intraday of course.......up until 4:30 pm Monday
 

Attachments

  • friday and mondays trades.doc
    200.5 KB · Views: 961
Hi Keith

Excellent results!
What data ranges did you base the strategy on this time around?

Cheers
Chris
 
Thanks,
Thats a 3 min chart, Friday and Monday. Im not a lover of Min charts as such, I think people ignore the true movents as shown in Tick charts.
If you remeber, when I was talking to you on the phone about a stat that was better than stocastics? This is it!


Regards
Keith
 
I think I should have used spell checker there somehow!

Too used to using Outllok express me thinks....lol

Dont forget to convert those numbers. For $ read Euros...
 
But going back to stocastics, try to think outside the box......heres what can be achived using them on the Dax and for good measure I have included them on the Dow. Both intraday trading, both over Friday and Monday (today) taking a measured target profit and a set stop loss throught the day and using only ONE conract per trade.
For $ read Euro's on the dax results, oh and by the way, theses are ALL with commissions taken out.
 

Attachments

  • dax trades friday&monday.doc
    75 KB · Views: 582
Top