Stan Weinstein's Stage Analysis


Quick Links:
■ Introduction (0:00)
■ Major Market Indexes – S&P 500, Nasdaq, NYSE & S&P 600 Small Caps (0:53)
■ VIX Volatility Index (5:34)
■ US Treasuries & Commodities – 7-10 Year US Treasuries, Gold, Crude Oil & Copper (6:56)
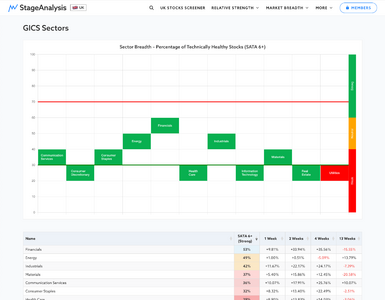
■ Sector Breadth: Percentage of Stocks Above Their 150 Day Moving Average – Relative Strength Table (9:51)
■ Sector Breadth: Percentage of Stocks Above Their 150 Day Moving Average – Overview Diagram (11:05)
■ NYSE Bullish Percent Index & Percentage of Stocks Above Their 200, 150 & 50 Day Moving Averages Charts (12:04)
■ US Combined Percentage of Stocks Above Their 200, 150 & 50 Day Moving Averages Charts (14:09)
■ NYSE Advance Decline Line Charts (15:55)
■ US New Highs - New Lows Charts & Momentum Index (17:21)
■ S&P 500 – Monthly 40 Year Chart (18:00)
■ Dow US Sub Sectors Relative Strength Rankings (20:00)

=======================

Weekend update of the major US stock market indexes and indicators. A weekly look beneath the surface of the US stock market, featuring the key market breadth charts for timing trading stocks and the stock market indexes, such as the NYSE Bullish Percent Index, the Advance Decline Line, the New Highs - New Lows etc and some custom breadth indicators of my own in order to determine what the "Weight of Evidence" is suggesting in terms of the US stock market direction and how to allocate your money.

Subscribe to the Stage Analysis YouTube Channel for all the latest videos here: Subscribe to the stageanalysis youtube channel
 
NEW – 3.5 Hour Video Course on the Stage Analysis Method – Part 1

I've created a new video course on Udemy about Stage Analysis, to help people new to method get up and running.
  • Learn the Four Stages of the Stan Weinstein's Stage Analysis Method
  • Learn the Ideal Stage 2 Entry Points for the Investor method and the Trader method to Maximise Profit Potential and Minimise Risk
  • Free 30 minute preview of the course – where you can learn about Stage 1 through four detailed examples.
Here's the link: Learn Stock Trading & Investing Techniques – Stage Analysis
 

Update of the major US stock market indexes and the key market breadth indicators. Plus a multi-time frame analysis of my current watchlist stocks near positions for potential trades, if they breakout on strong volume from their current bases: $PINS, $FSLY, $BYND, $BE, $WRTC, $ARLO

Learn Stage Analysis – Video Course
Learn the Four Stages of Stan Weinstein's Stage Analysis method and the Ideal Entry points for both the Investor and Trader methods in a 3.5 hour video course that runs through multiple real examples to help you learn what to look for.
Includes a 30 minute FREE preview. So start learning today via this link:
https://www.udemy.com/course/learn-stock-trading-investing-techniques-stage-analysis

Quick Links:
  • Major Market Indexes – S&P 500, Nasdaq, NYSE & S&P 600 Small Caps (0:53)
  • US Treasuries & Commodities – 7-10 Year US Treasuries, Gold, Crude Oil & Copper (3:37)
  • Sector Breadth: Percentage of Stocks Above Their 150 Day Moving Average – Relative Strength Table (5:37)
  • Sector Breadth: Percentage of Stocks Above Their 150 Day Moving Average – Visual Diagram (6:52)
  • NYSE Bullish Percent Index & Percentage of Stocks Above Their 200, 150 & 50 Day Moving Averages Charts (7:46)
  • US Combined Percentage of Stocks Above Their 200, 150 & 50 Day Moving Averages Charts (9:47)
  • Percentage of Stocks Above Their 20 Day Moving Averages Charts (11:05)
  • NYSE Advance Decline Line Charts (13:12)
  • US New Highs - New Lows Charts & Momentum Index (15:22)
  • Stocks In Focus
  • $PINS - Pinterest (16:30)
  • $FSLY - Fastly (18:52)
  • $BYND - Beyond Meat (20:58)
  • $BE - Bloom Energy (23:34)
  • $WRTC - Wrap Technologies (27:15)
  • $ARLO - Arlo Technologies (31:47)
  • Learn Stage Analysis Video Course on Udemy (35:14)
A regular look beneath the surface of the US stock market, featuring the key market breadth charts for timing trading stocks and the stock market indexes, such as the NYSE Bullish Percent Index, the Advance Decline Line, the New Highs - New Lows etc and some custom breadth indicators of my own in order to determine what the "Weight of Evidence" is suggesting in terms of the US stock market direction and how to allocate your money.
 
Top