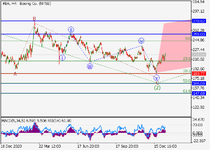
United States of America
USD is weakening against JPY and has ambiguous dynamics against GBP and EUR.
Investors are focused on the comments of US Federal Reserve officials regarding the high growth of inflation in the country. Yesterday, in an interview with CNBC, Philadelphia Fed President Patrick Harker said the current price increase requires urgent action, as it was more resilient than previously expected. To rectify the situation during the year, the official expects three or four rate increases. Chicago Fed President Charles Evans expressed a similar opinion, but, in his opinion, three raises would be most acceptable. Indeed, all the latest data points to growing inflationary pressures in the US economy. Published yesterday, the December statistics on the producer price index were no exception, and the figure was 9.7% YoY. The core producer price index was 8.3%, exceeding market expectations. Today’s US December retail sales figures were poor. Their volume decreased by 1.9% instead of the expected 0.1%, which could result from the Omicron epidemic, which is seriously holding back purchases.
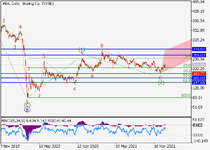
EUR is weakening against GBP and JPY but has ambiguous dynamics against EUR.
Eurozone trade balance data released today was poor. In November, instead of growing to 7.6B euros, the indicator fell by 1.5B euros. At the same time, payments for imports rose by 32.0%, while export revenues grew by only 14.4% due to a serious increase in prices for oil and gas exported to European countries. As for the positive news, it is worth noting that European companies managed to survive the next wave of the coronavirus pandemic relatively successfully. According to Reuters sources, Eurozone finance ministers acknowledged this at a meeting on Monday. The number of bankruptcies in European companies was less than expected, thanks to the effectiveness of the national measures to support liquidity in the amount of 2.3T euros adopted in the Eurozone. According to the official, the measures to support businesses can be continued for a long time, as companies' total debt continues to grow.
GBP is strengthening against EUR, weakening against JPY, and has ambiguous dynamics against GBP.
Published today, data on UK GDP for November were positive. The British economy grew by 0.9% after slowing to 0.2% a month earlier, reaching pre-pandemic levels. However, some experts fear that in December-January, the GDP indicator may decrease again, as the new wave of the Omicron coronavirus will be taken into account in the calculations. The service sector and retail trade, which have been actively recovering so far, may suffer the most damage. Chancellor Rishi Sunak, commenting on these data, noted that the government would continue to support the economy, including through subsidies, loans, and tax breaks for businesses. In November, the volume of industrial production in the UK also continued to grow. It increased by 1.0% MoM and by 0.1% YoY.
JPY continues to strengthen against its main competitors – GBP, USD, and EUR.
Today, the December data on the price index for corporate goods were published in Japan. It was –0.2% MoM and 8.5% YoY. This growth was the second largest after the November jump to 9.2%. An increase in wholesale prices could force Japanese firms to shift the burden of costs to the consumer, which would lead to an increase in consumer inflation, bringing it closer to the target level of 2.0%. The position of JPY is supported by media reports that officials of the Bank of Japan are discussing the possibility of raising the rate, despite the insufficient level of price growth in the country.
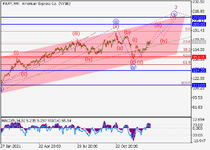
AUD is weakening against its main competitors – EUR, GBP, USD, and JPY.
The pressure on AUD is exerted by continuing the Omicron coronavirus pandemic and data on Chinese imports, published today. According to statistics for December, the volume of imports of goods to China slowed down growth from 31.7% to 19.5%, which was significantly worse than forecasts of 26.3%. China remains Australia's leading trading partner, and recent data may indicate a reduction in Australian goods and raw materials sales to this country. The November data of the Australian housing market, published today, were positive. The volume of housing loans increased by 7.6%, while the volume of investment in real estate increased by 3.8%.
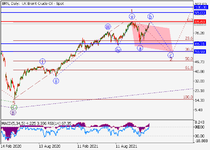
Oil quotes are trying to grow.
Investors remain optimistic about the growth in oil demand this year, as the governments of the leading oil-consuming countries are in no hurry to introduce severe restrictions due to the Omicron pandemic, and the capacities of the participants in the OPEC+ agreement are not yet sufficient to meet the needs of the market. Soon, China may release part of the oil from its strategic reserves to the market, but this measure is unlikely to have a lasting effect on the oil market.