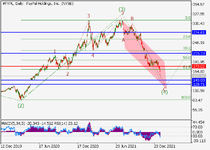
The price may fall.
On the daily chart, the third wave of the higher level (3) developed, and a downward correction develops as the fourth wave (4). Now, the wave C of (4) is forming, within which the third wave of the lower level iii of C has formed, a local correction has ended as the fourth wave iv of C, and the wave v of C is developing. If the assumption is correct, the price will fall to the levels of 140.00–128.71. In this scenario, critical stop loss level is 179.02.
Current trend
During the Asian session, the AUD/USD pair shows flat dynamics, holding near the level of 0.7130. Yesterday, the instrument steadily declined, having renewed local lows of December 20. However, by the time the daily session was closed, it partially restored lost positions.
The asset was supported by poor US macroeconomic data, which reduced the likelihood that the US Federal Reserve would raise rates more than four times in 2022. Thus, Markit Manufacturing PMI for January fell from 57.7 to 55.0 points, while analysts' forecasts suggested a decline to 56.7 points. Service PMI fell from 57.6 to 50.9 points, which was worse than forecasts of 55.0 points.
On Tuesday, further development of the upward dynamics is facilitated by data from Australia. In the fourth quarter of 2021, the consumer price index increased by 1.3% QoQ and 3.5% YoY, which was better than analysts' forecasts of +1.0% QoQ and +3.2% YoY.
Support and resistance
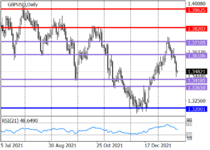
On the daily chart, Bollinger bands try to reverse into a horizontal plane. The price range expands from below, but not as fast as the "bearish" activity develops. The MACD indicator shows a moderate decline and keeps the same sell signal (the histogram is below the signal line). Stochastic keeps its downtrend but is quickly approaching its lows, indicating that the instrument may become oversold in the ultra-short term.
Current trend
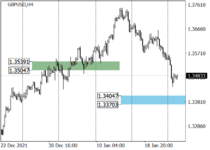
The British pound remains under pressure due to the difficult epidemiological situation in the country and poor macroeconomic data, and the GBP/USD pair may continue to decline towards the 1.3418–1.3365 area. Thus, Composite PMI in industry and services in the UK fell to 53.4 points from 53.6 points a month earlier, while analysts expected the index to rise to 55.0 points.
The long-term trend in the GBP/USD pair is downwards. After the breakdown of 1.3610, the rate decreases to 1.3418–1.3365. If this area is broken, further development of negative dynamics to the lows of December 2021 is possible.
The medium-term trend remains upwards. A correction is developing within its trend, the target of which is to test the key support at 1.3405–1.3370, after which new purchases can be considered with the target at the year's high.
Support and resistance
Resistance levels: 1.3610, 1.3710, 1.3820.
Support levels: 1.3418, 1.3365, 1.3200.
Current trend
The XRP/USD pair continues to trade within a long-term downward channel.
Last week, the token price dropped to the area of 0.5859, where it is now consolidating. The breakdown of this level allows further decline to the levels of 0.4883 and 0.3906. The key “bullish” area is the resistance zone of 0.7812–0.75. Its breakout allows growth to the levels of 0.91 and 0.9766.
In general, the downward trend in the market continues, which is confirmed by a downward reversal of Bollinger bands and an increase in the MACD histogram in the negative zone. However, the upward reversal of Stochastic from the oversold zone does not exclude a corrective growth of the Ripple to the area of 0.75 but is unlikely to break the current downtrend.
Support and resistance
Resistance levels: 0.75, 0.7812, 0.91, 0.9766.
Support levels: 0.5859, 0.4883, 0.3906.
EUR/USD
US Fed meeting results determine the dynamics of the pair
Current trend
This week, the EUR/USD pair actively fell due to the strengthening of the American currency, currently trading around 1.129.
The dollar is rising as investors await the outcome of the first meeting of the US Federal Reserve this year, which will end today. It is predicted that officials of the department will leave the rate at the same level in January but will announce their readiness to raise it in March. Most experts believe that to combat inflation, which was fixed at 7.0% for December, the regulator may need four or more adjustments this year. Another issue will be the reduction of the department's balance sheet, which has more than doubled during the pandemic. Most likely, the process will be launched as early as May or June after completing the emergency asset purchase program. In general, the market is tuned to the "hawkish" rhetoric of the US Federal Reserve, which, in turn, should contribute to further strengthening of the US currency but may create additional pressure on the stock market.
Support and resistance
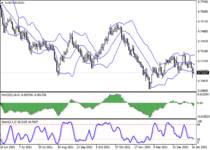
The consolidation below 1.1290 allows the EUR/USD pair to decrease to 1.1230 - 1.1185 . The key "bullish" level is 1.1350, Fibonacci correction, 23.6%, the middle line of Bollinger bands, which breakout will become a catalyst for upward dynamics to the area of 1.1470 , Fibonacci correction 38 .2%. The indicators do not give a single signal: Bollinger bands are horizontal, the MACD histogram is near the zero line, its volumes are insignificant, and Stochastic reverses upwards.
Resistance levels: 1.1350, 1.1413, 1.1475.
Support levels: 1.1290, 1.1230, 1.1185.
USD/CAD
Decline under pressure from rising oil prices
Current trend
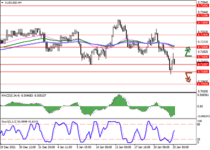
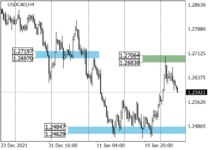
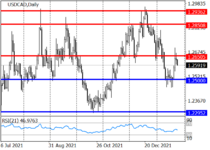
After the USD/CAD pair couldn't break the resistance level of 1.2650, it resumed its downward dynamics to 1.2500. The pressure on the asset is exerted by the growth of quotations for WTI Crude Oil, which reached $86 per barrel. Further strengthening of the oil prices to 90.00 will contribute to the continued decline of the USD/CAD pair and allow the "bears" to reach the level of 1.2500.
The long-term trend in the USD/CAD pair is upwards. At the moment, a correction is developing, and the breakdown of 1.2500 allows reaching the key support near 1.2295.
The medium-term trend is downwards. This week, the pair corrected to the key resistance 1.2706–1.2683, which allowed the "bulls" to close positions at favorable prices, and the "bears" — to form new sales with the targets at the last week's lows. The breakout of the key resistance of the trend allows growth to the target zone 2 (1.2950–1.2926).
Support and resistance
Resistance levels: 1.2650, 1.2850, 1.2936.
Support levels: 1.2500, 1.2295, 1.2161.
Brent Crude Oil
Further price growth is in the future
Current trend
Quotes of Brent Crude Oil are consolidating around 87.50, but they still cannot consolidate above it, despite active attempts. Short-term support for the asset was provided by a report published by the American Petroleum Institute (API), which reflected a reduction in US inventories by 0.872M barrels, significantly exceeding the market's expected to decline by 0.400M barrels.
In the long term, oil prices are strengthening due to geopolitical tensions in the Middle East and Ukraine. The infrastructure of the leading oil producers in Saudi Arabia and the United Arab Emirates is still under the threat of Yemeni Houthi missile attacks, which threatens to disrupt the oil supply to the market. The last attack took place on Monday but did not have serious consequences. Also, the increase in geopolitical tension around Ukraine, and even more so the start of an open military conflict, can lead to interruptions in the supply of oil and gas to consumers. The negative outlook also supports global energy prices, but their serious growth is hindered by today's US Federal Reserve meeting on monetary policy. The regulator may announce an adjustment to the existing parameters, strengthening the dollar and putting pressure on the oil market.
Support and resistance
Resistance levels: 87.50, 90.60, 93.75.
Support levels: 83.50, 81.25, 78.12.
The pair may grow.
On the daily chart, a downward correction developed as the wave of the higher level 4, and the development of the fifth wave 5 started, within which the wave (1) of 5 forms. Now, the third wave of the lower level 3 of (1) is developing, within which the wave i of 3 has formed, and a local correction has ended as the wave ii of 3. If the assumption is correct, the pair will grow to the levels of 1.3200–1.3410. In this scenario, critical stop loss level is 1.2446.
By Solid ECN
The pound is under pressure from the results of the US Fed meeting
Currently, the pound is under pressure from the outcome of the US Fed meeting. The regulator, as expected, announced its intention to raise the interest rate on short-term loans by 0.25% in the near future, but the exact date was not announced, however experts continue to believe that this will happen in March. In addition, a reduction in the balance sheet of the US Fed was announced, which now significantly exceeds the required volume. Commenting on the current situation, the head of the regulator Jerome Powell noted that the recovery of the labor market and rising inflation suggest that the economy no longer needs serious stimulation. At the same time, the risks of a long delay in inflation at current levels and even its growth remain, but officials do not consider this scenario to be basic. In general, Powell's comments indicate the intention of the department to continue tightening monetary policy, which in the long term will support the US currency.
Resistance levels: 1.3550, 1.3672, 1.3732.
Support levels: 1.3427, 1.3366, 1.3306.
The price may grow.
On the daily chart, the upward wave C forms, within which the first wave 1 of (1) of C develops. Now, the fifth wave of the lower level v of 1 is forming, within which the wave (iii) of 1 is developing. If the assumption is correct, the price will grow to the levels of 100.00–115.00. In this scenario, critical stop loss level is 69.45.
The pair may grow.
On the daily chart, the fifth wave of the higher level (5) develops, within which the first entry wave 1 of (5) formed, the correctional wave 2 of (5) developed, and the wave 3 of (5) forms. Now, the third wave of the lower level iii of 3 is developing, within which the wave (iii) of iii is forming. If the assumption is correct, the pair will grow within the wave to the levels of 1919.90–2067.60. In this scenario, critical stop loss level is 1752.82.
The S&P 500 has lost 9.7% from its peak this year and is likely to continue its downtrend amid an outflow of investor capital in anticipation of the upcoming tightening of the monetary policy by the US Federal Reserve.
The medium-term trend in the asset changed to a downtrend last week with reaching the target zone (4376-4354), which was broken this week, opening a new target for the "bears" at the target zone (4146-4123). The trend boundary is shifting to the area of 4550.0–4437.0, from where it is possible to search for new short positions.
The short-term trend is downward. Yesterday, market participants broke through the support zone 4345.9–4335.1, and now the target for sales is the target zone 4237–4216. In addition, the key trend resistance at 4389–4378 was tested the day before, which led to a new wave of sales.
Resistance levels: 4437, 4550, 4674
Support levels: 4223, 4123, 4050.
The price may grow.
On the daily chart, the upward wave C forms, within which the first wave 1 of (1) of C develops. Now, the fifth wave of the lower level v of 1 of (1) is developing, within which the wave (iii) of 1 is forming. If the assumption is correct, the price will grow to the levels of 100.00–110.00. In this scenario, critical stop loss level is 75.
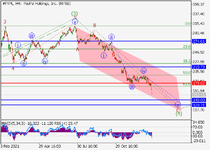
The pair may fall.
On the daily chart, the first wave of the higher level (1) of 3 formed, and a downward correction develops as the wave (2) of 3. Now, the wave C of (2) is forming, within which the fifth wave of the lower level v of C is developing. If the assumption is correct, the price will fall to the levels of 20.53–18.34. In this scenario, critical stop loss level is 24.62.
The price may grow.
On the daily chart, the third wave of the higher level (3) formed. Now, a downward correction has formed as the fourth wave (4), within which the wave C of (4) has formed, which has reached the correctional level of 62%. If the assumption is correct, the price will grow to the levels of 507.54–702.06. In this scenario, critical stop loss level is 350.54.
Current trend
The EURUSD pair corrects within a downtrend, trading around the level of 1.116.
Additional pressure on the euro is exerted by a serious slowdown in the leading economies of the EU. Meanwhile, the USD Index topped 97 to trade at 97.1. In general, against the backdrop of a rising US dollar, the euro looks like a less attractive instrument for investment, and the current downward trend in the EUR/USD pair is likely to continue this week.
Support and resistance
The currency pair is declining within the global Flag pattern. Indicator Alligator's EMA fluctuations range expands downwards, and the histogram of the AO oscillator began to form downward bars, being in the sell zone.
Resistance levels: 1.1233, 1.1455.
Support levels: 1.1119, 1.1.
Current trend
The price of the stocks of the global giant in the field of development and sale of personal and tablet computers Apple Inc. continues to trade in a corrective trend, being around 170.
Apple Inc. has very successfully started the new fiscal year 2022, demonstrating revenue of 123.9B dollars in Q1, which became an absolute record in the history of the company. This figure is 11% higher than the results of the same period a year earlier.
At the end of the quarter, the Board of Directors decided to send 0.22 dollars per share to the holders of its assets. The cut-off of the register of shareholders is scheduled for February 7, and the payment itself is scheduled for February 10, 2022. The estimated yield may be about 0.52% per annum, which is the average for the company.
Support and resistance
On the global chart of the asset, a global ascending channel continues to form, within which the price is located. Technical indicators are still in the state of a sell signal, which is beginning to weaken. The range of fluctuations of the EMA of the alligator indicator began to narrow, and the histogram of the AO oscillator, being below the zero line, formed the first ascending bar.
Resistance levels: 175, 182.
Support levels: 168, 158.