SLAyers' Notes

Status
Not open for further replies.
How do you apply the W and D lines to 1 minute or seconds charts to enter a trade?

Do the trend lines that are drawn on the D and W charts correlate with the lower time frame charts to enter an intraday trade?

I'm trying to figure out how to piece it all together? Do you utilize the SLA on the D, W and Hourly charts to find key levels? How is it applied to the 1 minute and seconds charts?

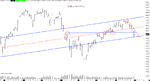
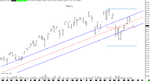
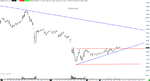
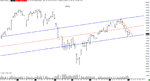
Trends, trendlines, and channels are addressed in all three sections of the book. I suggest beginning with pp. 39ff in the SLAB. "Trading Opportunities" in Notes will also be of interest. Then of course there are the posts in this thread.

Db
 
recap

Completed 2 trades prior to the reversal at 4440.

Price opened ranging below the apex, 7 minutes passed before price broke higher with an entry being triggered on a ret. Whilst the ret confirmed PA backed up immediately (first warning) then broke the swing point and stride in quick succession trade exited, done on the 10 sec chart as the trade failed too soon after entry.

The second trade was a short off the SL of the hinge, 30 sec chart, entered off the ret after the DL break. Initially headed in the right direction and then tested the MP of the Lo-Hi and failed, stride break was enough to trigger exit on its own, but, I was working off the DP. The higher low triggered a long, trade was exited and I was flat.
 

Attachments

  • nq2804201610-30scover.png
    nq2804201610-30scover.png
    79.2 KB · Views: 201
  • nq280420161min.png
    nq280420161min.png
    33.4 KB · Views: 197
NQ Daily from today.

1. Wait for the break of the Demand Line/Support and enter on a RET to go Short

2. See if the Support line holds and take a Long position

3. Wait and see..
 

Attachments

  • downloadfile-1.png
    downloadfile-1.png
    78.8 KB · Views: 221
NQ Daily from today.

1. Wait for the break of the Demand Line/Support and enter on a RET to go Short

The price has moved down quite a bit. There's no guarantee it can't continue lower, however, the probability has been shifting. IOW another addition to the short side if one's already in isn't bad but to initiate a position here is riskier, considering this is a mean reverting instrument.

Gringo
 
Weekly and daily has price at the LL of the channel but the daily has a little overhead to overcome. Hourly has broken a sharper SL and the 10 minute is tentatively heading higher but the BO PM has failed to follow through.
 

Attachments

  • nq0205201660min.png
    nq0205201660min.png
    31 KB · Views: 162
  • nq02052016daily.png
    nq02052016daily.png
    54.7 KB · Views: 174
  • nq02052016weekly.png
    nq02052016weekly.png
    38.1 KB · Views: 140
  • nq0205201610min.png
    nq0205201610min.png
    29.1 KB · Views: 154
Last edited:
Daily: Price has moved back towards the LL, supply line is still in play but AMT would have the line of least resistance as up.
Hourly: Price could be forming a hinge, overnight saw price RET beyond 50% of the most recent Lo-Hi (could be further weakness).
10 Minute: The overnight drop was stopped at the apex level of the PD morning hinge, pre drop high to PM low (not marked) worth noting.
 

Attachments

  • nq03052016daily.png
    nq03052016daily.png
    33.3 KB · Views: 145
  • nq0305201660min.png
    nq0305201660min.png
    29.6 KB · Views: 150
  • nq0305201610min.png
    nq0305201610min.png
    31.7 KB · Views: 145
NQ Weekly: At bottom of TC (see weekly 1 post above).
NQ Daily: Trend is down.
NQ 4 hourly: Trend is down. TC.
NQ 1 hourly: Hinge

Gringo
 

Attachments

  • tvc_074c6e19461e73767684be2f069eb245.png
    tvc_074c6e19461e73767684be2f069eb245.png
    35.7 KB · Views: 159
  • tvc_e02e1bde6682381b32626cd2044e2fc9.png
    tvc_e02e1bde6682381b32626cd2044e2fc9.png
    33.7 KB · Views: 157
  • tvc_041b5c2451cdbdaa17eff6d4eedaca50.png
    tvc_041b5c2451cdbdaa17eff6d4eedaca50.png
    37.5 KB · Views: 159
Just wanted to post some charts to make sure I'm on the right track.

Any advice/feedback would be greatly appreciated.
 

Attachments

  • NQ 06-16 (60 Min)  5_4_2016.png
    NQ 06-16 (60 Min) 5_4_2016.png
    63.5 KB · Views: 161
  • NQ Chart.png
    NQ Chart.png
    60 KB · Views: 225
Hello SLAyers,

When you are drawing the "Mean" line... Is there a specific way that you go about to getting the right line?

Any tips on how to draw the correct "Mean"?

Ive attached a 30 Minute NQ Chart with TL and "Median" line ... Any advice on if I am doing this correctly would be greatly appreciated.

Also, I am new to SLA/AMT and maybe jumping a bit ahead in my studies but I am trying to figure it is all pieced together.

For example: I am looking for an intraday Trade in the NQ. Looking at the D/W/H/30M/10M/1M, etc charts. I can see the overall Trend in the D and W. But how do you apply that to finding an intraday trade?

I am unsure on how to piece that all together and how to properly apply it intraday. From the higher time frame charts to finding a trade on the 1min or even on a seconds chart.

Thank you to all who is part of this thread. Much better forum than the bashing that goes on some others.
 

Attachments

  • NQ 06-16 (30 Min)  5_4_2016.png
    NQ 06-16 (30 Min) 5_4_2016.png
    52.6 KB · Views: 158
D Chart NAS100

Just another chart to make sure I'm on the right track.

Question: How come the pricing is different from my NQM6 on NinjaTrader different than the one we are using here?
 

Attachments

  • uLtpBnqN.png
    uLtpBnqN.png
    80.4 KB · Views: 164
Just another chart to get everyone's thoughts to see if I am on the right track with SLA
 

Attachments

  • NQ Chart.png
    NQ Chart.png
    64.3 KB · Views: 176
Just wanted to post some charts to make sure I'm on the right track.

Any advice/feedback would be greatly appreciated.

Your hourly chart is drawn correctly but would most likely be of little use in real time as the first TO doesn't appear until the 28th. After that the channel dissipates as short-term channels do.

Your 1m chart is correct from an observational standpoint, but you have not mentioned your risk tolerance and how that would affect your trade management. There is also the problem of practicality: if you have a job, intraday charts are off the table.
 
Hello SLAyers,

When you are drawing the "Mean" line... Is there a specific way that you go about to getting the right line?

Any tips on how to draw the correct "Mean"?

Ive attached a 30 Minute NQ Chart with TL and "Median" line ... Any advice on if I am doing this correctly would be greatly appreciated.

Search the book for "mean" and "median" using Ctrl+F.
Search this thread for the same terms using the Search function.

Also, I am new to SLA/AMT and maybe jumping a bit ahead in my studies but I am trying to figure it is all pieced together.

For example: I am looking for an intraday Trade in the NQ. Looking at the D/W/H/30M/10M/1M, etc charts. I can see the overall Trend in the D and W. But how do you apply that to finding an intraday trade?

I am unsure on how to piece that all together and how to properly apply it intraday. From the higher time frame charts to finding a trade on the 1min or even on a seconds chart.

Thank you to all who is part of this thread. Much better forum than the bashing that goes on some others.

See "Trading Opportunities" in Notes.
 
D Chart NAS100

Just another chart to make sure I'm on the right track.

Question: How come the pricing is different from my NQM6 on NinjaTrader different than the one we are using here?

There are variations in data feeds. When it comes to a feed that you'll be paying for, check it against the data at the CME site if you're going to trade the NQ. If it doesn't match, look for another provider.
 
There are variations in data feeds. When it comes to a feed that you'll be paying for, check it against the data at the CME site if you're going to trade the NQ. If it doesn't match, look for another provider.

Thank you. I think I figured it out.

Everyone who is trading NQ is trading NQM6, right? I was looking at NAS100 on TradingView (Or charts powered by TradingView) and that's where the price difference came in play.
 
One of these charts is not like the others ...

Db,

The attached image from this morning shows something I regularly see on IB charts. I wonder if you have any view about it, whether it's general issue or an IB or configuration anomaly: specifically, price wrt trendlines on longer time frame charts not aligning with price wrt trendlines on shorter time frame charts.

In all three time frames in the image, upwards trendlines are drawn between lows on Apr 28 and May 2.

As you can see, the DAY chart shows the price on May 5 (today) opening right at the trendline, whereas the MIN60 and MIN10 charts have price opening higher wrt the same upwards trendline in each chart. I don't think that this is an issue of relative size of the 3 charts -- I've zoomed in on the DAY chart and it's clear that the open price there is proportionately much closer to the trendline than on the other two charts.

All 3 charts use non-log scale and do not show after-hours trading. Varying the aspect ratio does not change things.

On other occasions, I've seen differences between different intraday time frames.

If this is what others see, it suggests that people trading different time frames don't actually see the same chart.

Any pov ?

Regards, aka_ces
 

Attachments

  • CHART_INCONSISTENCIES.VXX.2016-05-05.png
    CHART_INCONSISTENCIES.VXX.2016-05-05.png
    765.2 KB · Views: 245
Last edited:
Your hourly chart is drawn correctly but would most likely be of little use in real time as the first TO doesn't appear until the 28th. After that the channel dissipates as short-term channels do.

Your 1m chart is correct from an observational standpoint, but you have not mentioned your risk tolerance and how that would affect your trade management. There is also the problem of practicality: if you have a job, intraday charts are off the table.


Thank you for the advice!

At this point I am just observing and applying what I am reading in your book in real time. How traders respond at certain levels, etc

I will be trading SLA/AMT during RTH. My risk is 2 points.

I am still studying but that is what I am trying to figure out. Applying SLA during RTH. Is the 1 min sufficient? Do I need to look at the D,W or even H? If so, how do I apply that when I am looking for entry on the 1 min chart?

I can look at the D and W to see the overall Trend and where we are at but when I look for a trade on a 5 min or 1 min chart, how do I piece that together in regards to taking a trade today?

I'm still studying the book but just wanted to get some clarity on that as I keep studying.

Thank you
 
Your hourly chart is drawn correctly but would most likely be of little use in real time as the first TO doesn't appear until the 28th. After that the channel dissipates as short-term channels do.

Your 1m chart is correct from an observational standpoint, but you have not mentioned your risk tolerance and how that would affect your trade management. There is also the problem of practicality: if you have a job, intraday charts are off the table.


In regards to the 1 min chart... I just wanted to get some feedback if my comments on there were in line with SLA/AMT? If they are tradeing opportunities that correctly line up with SLA.

As I am still studying... I am observing and applying SLA during RTH and studying after the close. Making sure I am applying it correctly so I wanted to post my 1 min chart with what I thought was in line with SLA and valid trades. Or if I needed to change anything etc
 
Db,

The attached image from this morning shows something I regularly see on IB charts. I wonder if you have any view about it, whether it's general issue or an IB or configuration anomaly: specifically, price wrt trendlines on longer time frame charts not aligning with price wrt trendlines on shorter time frame charts.

In all three time frames in the image, upwards trendlines are drawn between lows on Apr 28 and May 2.

As you can see, the DAY chart shows the price on May 5 (today) opening right at the trendline, whereas the MIN60 and MIN10 charts have price opening higher wrt the same upwards trendline in each chart. I don't think that this is an issue of relative size of the 3 charts -- I've zoomed in on the DAY chart and it's clear that the open price there is proportionately much closer to the trendline than on the other two charts.

All 3 charts use non-log scale and do not show after-hours trading. Varying the aspect ratio does not change things.

On other occasions, I've seen differences between different intraday time frames.

If this is what others see, it suggests that people trading different time frames don't actually see the same chart.

Any pov ?

Regards, aka_ces

I don't know what those lines are so I can't help you. At the least, the SLA is about simplicity. The attached, for example, is what I was looking at before yesterday's open.
 

Attachments

  • Display 050516.gif
    Display 050516.gif
    85.8 KB · Views: 174
Last edited:
Status
Not open for further replies.
Top