SLAyers' Notes

Status
Not open for further replies.
That would possibly be a deal breaker for me if I had to do that, the first chart I posted shows the options that I have for how the information is displayed, if I change how it is displayed my lines can be way off hence the differences between the two charts.

Can you elaborate on the options you are able to change? I can't find anything on ToS that I think may change how it is displayed but I am new at this.

Also, which platform and broker are you using if you don't mind me asking?
 
Last edited:
Got me thinking.

Can you elaborate on the options you are able to change? I can't find anything on ToS that I think may change how it is displayed but I am new at this.

I will try but I am not 100% sure about the mechanics of it.

There are four contracts traded throughout the year March (H), June (M), September (U) and December (Z) (someone might have to step in here and correct if I am wrong). Traders will transition over time from one contract to the other, and the two contracts traded at the same time may have different prices.

My charts will switch from one contract to the other at a set date (Date based roll over), which is the third Friday of the expiry month, or, the switch might happen when the volume in the new contract is greater than the old, (volume based roll over) this may happen ahead of the roll over date.

I have checked over charts posted on the days around the July high and they come in at 86, I went back further and found my own charts I saved at the time of those earlier swing points discussed and they also matched up with the non adjusted chart.

The problem seems to be in historic/long term charts or at least one that covers multiple contract roll overs, I don't know what is causing the discrepancy between platforms, data providers and brokers, and I don't know what exactly CME is basing their prices off as they seem to be off as well.

:confused:

Sierra charts, Infinity.
 
Last edited:
If you type in the full contract symbol (/NQZ5) on ToS you get about 4 months of data that matches the CME, for example, a July high of 77. The problem is if you want a longer time frame you need to use the more general symbol /NQ -- and then the data changes.

If you click on the gear icon, chart settings, then go to the futures tab, you'll see the "adjust for contract changes" box and the "daily close" drop down menu. With /NQ in the symbol box, depending on what options you chose, the level for July is either 86 or 71. Quite annoying!

I checked again and yes, NQZ5 trades at 4677.25 in July, but, the contract being traded in July was NQU5 which at the time was 4686. I think the CME data is based on the front contract looking back, what I mean is that when we swap to NQH6 the values we see today on the most recent activity will change to what the H contract was doing at the time.

The non adjusted charts and the swing points used in the TL by EldnitJ are exactly the values of what was traded at the time, I wonder if a continuous back adjusted chart changes the value depending on what the current active contract trading did at the time?

I agree this is frustrating.
 
Last edited:
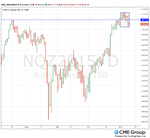
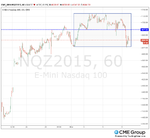
Gring0, is this a legitimate new range?
 

Attachments

  • 11.3 daily.png
    11.3 daily.png
    49 KB · Views: 139
  • 11.3 one hour.png
    11.3 one hour.png
    49.4 KB · Views: 140
.
 

Attachments

  • Screen Shot 2015-11-09 at 5.40.51 PM.png
    Screen Shot 2015-11-09 at 5.40.51 PM.png
    33.4 KB · Views: 123
  • Screen Shot 2015-11-09 at 5.40.36 PM.png
    Screen Shot 2015-11-09 at 5.40.36 PM.png
    38.2 KB · Views: 123
  • Screen Shot 2015-11-09 at 5.54.18 PM.png
    Screen Shot 2015-11-09 at 5.54.18 PM.png
    32 KB · Views: 118
Gring0, is this a legitimate new range?

It may or not be a range. I look at price at top and see it had trouble going higher than the top. I look at price now and see it has recently bounced without continuing down so far. It does give a general idea to be alert to possible bounce here. I don't know if it's a legitimate range or not.

What is a legitimate range? From what I understand it's a time bound sideways activity around a mean. The mean is a tricky business here to identify and if it's hard to determine the mean it's a bit tricky to conclude it's a definable range. Price spent most of the time above the potential mean and is now below it. Whether it spends time here or does something else is anyone's guess.

Gringo
 
Last edited:
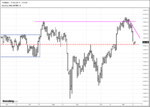
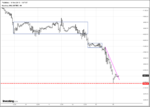
This is uncanny. I drew this demand line yesterday and wasn't sure where exactly to put it. I decided on the close yesterday at 11:00 bar and Monday at the 10:00 bar. Where does price reverse this morning. I'm sure it is just pure luck.
 

Attachments

  • Screen Shot 2015-11-11 at 10.30.37 AM.png
    Screen Shot 2015-11-11 at 10.30.37 AM.png
    45.2 KB · Views: 140
Last edited:
manraygun,

I have also noticed in ToS that checking the "adjust for futures contract" does not change the weekly on my charts.The July high on the daily will be 71 then switch to the weekly chart the July high is 86.
 
Last edited:
Am I correct in saying that the break today below yesterdays low was a short entry on the daily?
 
The conviction to take the trades suggested yesterday comes not from waiting to be told what to do or for someone to make a "call". Nor does it arise from unquestioning faith in AMT. Rather it is the result of study and practice and more study and more practice, in replay and in real time, each session accompanied by and followed by the recording of meticulous notes, every day, day after day, even if one is not trading that day. Those who were not aware of the context for yesterday's trades since Tuesday evening should ask themselves why, particularly if they have been at this for more than a few months and still struggling.
6. Record-keeping. It is essential to collect and maintain records of your end-of-session reviews (you are of course doing end-of-session chart/trade reviews). If you do not keep track of what you did right and what you did not-right and the results of each, you won't be looking at early retirement any time soon. Avoid, however, the I'm A Useless Sack drama. Focus instead on what you saw correctly, what you missed that you should not have missed, what you missed that the greatest trader on the planet would have missed, which trades were made according to plan and which weren't (along with why, so that you can avoid the same behavior in future). Review Appendices E and F. (p. 135)​
Those who aren't maintaining these records, including meticulous real-time notes, are spinning their wheels, and unless they want to spend years learning "how to trade" like so many do, I suggest they spend some quality time with Appendix E.

Db
205150d1446898162t-slayers-notes-amt-practicum-8.gif

Considering all of the notice given, how many people profited from this week's moves? Did the precise placement of a line make any difference? Were bars the determining factor? Or was it the movement of price?

Db
 

Attachments

  • Wkly Nov13.gif
    Wkly Nov13.gif
    74.1 KB · Views: 181
Considering all of the notice given, how many people profited from this week's moves? Did the precise placement of a line make any difference? Were bars the determining factor? Or was it the movement of price?

Db

I can tell you that even 1m interval was quite profitable.
 
Last edited:
Am I correct in saying that the break today below yesterdays low was a short entry on the daily?

I don't want to give the wrong impression that it was the only entry. Even on daily bar intervals there was another entry. Where one enters is a function of one's risk tolerance. Another entry that didn't show up would have been had price gotten back to around 4700 on the daily. What one takes as an entry takes into account the risk factor and the fear factor of the trader.

Gringo

Are you referring to Monday when price opened at 4701.25 and briefly went higher to 4712.25 and then promptly started its descent? I assumed you are considering that a brief retracement?

After rereading your response I realized you were not speaking of what I mentioned. But would that also be considered a possible entry?
 
Last edited:
Are you referring to Monday when price opened at 4701.25 and briefly went higher to 4712.25 and then promptly started its descent? I assumed you are considering that a brief retracement?

After rereading your response I realized you were not speaking of what I mentioned. But would that also be considered a possible entry?

The one you mentioned is the cleanest one. The earlier one we're talking about did have a retracement, only it was within the bar and then price slumped. I am only showing possibilities of a tighter DL. Price is continuous and at times shows behaviour within the bar.

Look at Db's charts, and see that tighter DL. Also note that one doesn't have to make things complicated. I prefer when price comes back to previous high before shorting. It allows me the peace of mind that I seek. It decreases risk but also increases the chance of missing out on a move if price isn't behaving that way.

Stick with what is most straight forward and as you become comfortable with it, other possibilities start becoming visible. It's better to stick with one simple behaviour and making it your own.

Gringo

I failed to draw the tighter DL and didn't see the entry as it was happening. Also one should have noticed price on 11/4 went nowhere on increasing volume. That was sign that we were possibly topping I would think.

Thanks Gringo
 
Status
Not open for further replies.
Top