You are using an out of date browser. It may not display this or other websites correctly.
You should upgrade or use an alternative browser.
You should upgrade or use an alternative browser.
- Status
- Not open for further replies.
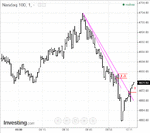
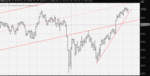
Db, I follow the logic of #179. 🙂 But in #180... while there is a lower high indicating a possible down move, price is near equilibrium (mid point of a range). Isn't this typically an area of chop and thus to be avoided for trade entry? Thanks.
eminiman414
Newbie
- Messages
- 3
- Likes
- 0
SL break:
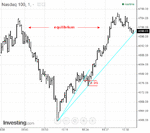
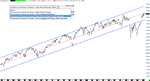
Would you consider that move down below 75ish a shakeout on a longer bar interval?
dbphoenix
Guest Author
- Messages
- 6,954
- Likes
- 1,266
Db, I follow the logic of #179. 🙂 But in #180... while there is a lower high indicating a possible down move, price is near equilibrium (mid point of a range). Isn't this typically an area of chop and thus to be avoided for trade entry? Thanks.
If one is trading this in real time, he sees the reach at 0940/41 and rapid failure. There's no time to think and deliberate. There is only enough time to determine the DP and decide if the trade is worth the risk.
The middle of the range is typically an area of chop and that's where traders spent the 4th. But then they tested the upper limit of the range yesterday and the lower limit of the range this morning. If he's traded the reversal, he's made 25pts by the time price returns to what is or had been equilibrium. If he thinks trading is done by 0945, he can stop. Or, again, he can determine the DP and decide whether or not he wants to assume the risk of losing a few points vs the potential profit in a return to the lower limit.
There's no time for any of this while price is moving, of course, which is why this must be practiced via replay rather than via study of static charts.
Db
dbphoenix
Guest Author
- Messages
- 6,954
- Likes
- 1,266
Would you consider that move down below 75ish a shakeout on a longer bar interval?
Looks like it on the hourly, though I don't know that I'd call it a shakeout. More of an exploration. If one had not been short, it would be another factor in considering a long trade if price were to return to the range, as it did. But that would have been yesterday. Today was a test of it.
Db
eminiman414
Newbie
- Messages
- 3
- Likes
- 0
Looks like it on the hourly, though I don't know that I'd call it a shakeout. More of an exploration. If one had not been short, it would be another factor in considering a long trade if price were to return to the range, as it did. But that would have been yesterday. Today was a test of it.
Db
Gotcha. Exploration makes sense. In theory, if it was a "shakeout" would the opposite end of the range (the upper limit)have broken? Since we stayed in the range thereafter "exploration" seems like a better term. I like it.
dbphoenix
Guest Author
- Messages
- 6,954
- Likes
- 1,266
Thrusts and shakeouts are part of accumulative and distributive bases. While one could argue that 50pts is too wide and two days is too short, it really doesn't matter. Price tried five times to get past the UL of the range. The message of that is enough.
As for whether or not to exit his short and go long at the LL, that's pretty much decided for him. The SL is broken around 1100 (I assume you're talking about yesterday) and a long op provided shortly thereafter.
As far as "exploration", remember that traders really don't give a damn about the stuff found in the books peddled to the retail trader. Traders are looking for trades. If buyers had not stepped in to reverse price yesterday morning, price would have continued falling. Whether or not all of this took place at the lower limit of a range is only context for the retail trader, who is seeking to follow those who are moving price.
Db
dbphoenix
Guest Author
- Messages
- 6,954
- Likes
- 1,266
The conviction to take the trades suggested yesterday comes not from waiting to be told what to do or for someone to make a "call". Nor does it arise from unquestioning faith in AMT. Rather it is the result of study and practice and more study and more practice, in replay and in real time, each session accompanied by and followed by the recording of meticulous notes, every day, day after day, even if one is not trading that day. Those who were not aware of the context for yesterday's trades since Tuesday evening should ask themselves why, particularly if they have been at this for more than a few months and still struggling.
Db
6. Record-keeping. It is essential to collect and maintain records of your end-of-session reviews (you are of course doing end-of-session chart/trade reviews). If you do not keep track of what you did right and what you did not-right and the results of each, you won't be looking at early retirement any time soon. Avoid, however, the I'm A Useless Sack drama. Focus instead on what you saw correctly, what you missed that you should not have missed, what you missed that the greatest trader on the planet would have missed, which trades were made according to plan and which weren't (along with why, so that you can avoid the same behavior in future). Review Appendices E and F. (p. 135)
Those who aren't maintaining these records, including meticulous real-time notes, are spinning their wheels, and unless they want to spend years learning "how to trade" like so many do, I suggest they spend some quality time with Appendix E.Db
Attachments
The conviction to take the trades suggested yesterday comes not from waiting to be told what to do or for someone to make a "call". Nor does it arise from unquestioning faith in AMT. Rather it is the result of study and practice and more study and more practice, in replay and in real time, each session accompanied by and followed by the recording of meticulous notes, every day, day after day, even if one is not trading that day. Those who were not aware of the context for yesterday's trades since Tuesday evening should ask themselves why, particularly if they have been at this for more than a few months and still struggling.
6. Record-keeping. It is essential to collect and maintain records of your end-of-session reviews (you are of course doing end-of-session chart/trade reviews). If you do not keep track of what you did right and what you did not-right and the results of each, you won't be looking at early retirement any time soon. Avoid, however, the I'm A Useless Sack drama. Focus instead on what you saw correctly, what you missed that you should not have missed, what you missed that the greatest trader on the planet would have missed, which trades were made according to plan and which weren't (along with why, so that you can avoid the same behavior in future). Review Appendices E and F. (p. 135)Those who aren't maintaining these records, including meticulous real-time notes, are spinning their wheels, and unless they want to spend years learning "how to trade" like so many do, I suggest they spend some quality time with Appendix E.
Db
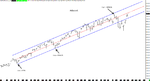
Db, could you show the complete channel on your daily chart? On my daily, the high at 4729.75 is still 30 points below the mean of the channel. Is this the difference between using /NQ and the Nasdaq 100 at Investing.com?
dbphoenix
Guest Author
- Messages
- 6,954
- Likes
- 1,266
Db, could you show the complete channel on your daily chart? On my daily, the high at 4729.75 is still 30 points below the mean of the channel. Is this the difference between using /NQ and the Nasdaq 100 at Investing.com?
The weekly is imposed on the daily.
I'll be off for a week. In the meantime, I suggest that those who have the book study Appendix E in particular, and, of course, Appendix D.
Db
Attachments
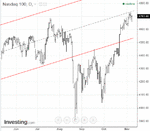
The weekly is imposed on the daily.
I'll be off for a week. In the meantime, I suggest that those who have the book study Appendix E in particular, and, of course, Appendix D.
Db
I adjusted my TL's all I could and it is still 10-12 points away. This is a daily imposed on weekly TL's.
Attachments
I adjusted my TL's all I could and it is still 10-12 points away. This is a daily imposed on weekly TL's.
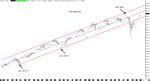
Anyone else show this discrepancy?
Kleft
Member
- Messages
- 56
- Likes
- 29
Anyone else show this discrepancy?
The discrepancy might be down to how your charts display the information you are working from. Without the back adjustment my charts look like the one you have posted with a July high at 4686, with the back adjustment I get a July high at 4676.5, not exact, but a lot closer.
Point being, you might be drawing your lines correctly but the swing points might be off a touch due to how the information is rolled up into a continuous chart.
Hope it helps.
Attachments
Last edited:
The discrepancy might be down to how your charts display the information you are working from. Without the back adjustment my charts look like the one you have posted with a July high at 4686, with the back adjustment I get a July high at 4676.5, not exact, but a lot closer.
Point being, you might be drawing your lines correctly but the swing points might be off a touch due to how the information is rolled up into a continuous chart.
Hope it helps.
Something is still amiss. Look at Db's and my chart on 8/10 and 8/11, the mean crosses the tops of both bars and on your chart the mean crosses the tops of 8/17 and 8/18 bars. Yet Db's and your mean hits the tops of the last swing high on 11/3 and 11/4 but mine does not. So on 8/10 Db and my mean line up very close and yours is 10 points lower but on 11/3 Db and your mean are in sync while mine is not. It has to be where our TL's are drawn at the beginning of the trend which will swing the lines up or down on the right side of the charts. I'm just a little confused with this. Apparently my TL is drawn wrong but I can't see it without seeing the left side of Db's TC.
Last edited:

Kleft
Member
- Messages
- 56
- Likes
- 29
Here's my weekly, the bottom TL connects on the 6/24/13 low(2817.75) and the 4/15/14 low(3404.75) . Does this look legit to you all?
I have posted two charts to show the discrepancy, I am not entirely sure how far off my adjusted charts are to the CME data but they are a lot closer than the non-adjusted charts.
The discrepancy becomes greater the further back one looks, the first point at which the TL is drawn is a 60 point difference, the second point is 40 and the last swing high is a difference of 9 points.
This discussion came up at the end of last month and I believe your platform was showing the July high at 4686 (I cant tell exactly where that high is on your chart), if this is the case your chart reflects the non adjusted chart I have posted. You may need to explore your chart settings and see if you can get your platform to closer reflect the adjusted chart swing points, but like I mentioned, even my swing points are off a little according to CME.
Attachments
I have posted two charts to show the discrepancy, I am not entirely sure how far off my adjusted charts are to the CME data but they are a lot closer than the non-adjusted charts.
The discrepancy becomes greater the further back one looks, the first point at which the TL is drawn is a 60 point difference, the second point is 40 and the last swing high is a difference of 9 points.
This discussion came up at the end of last month and I believe your platform was showing the July high at 4686 (I cant tell exactly where that high is on your chart), if this is the case your chart reflects the non adjusted chart I have posted. You may need to explore your chart settings and see if you can get your platform to closer reflect the adjusted chart swing points, but like I mentioned, even my swing points are off a little according to CME.
Thanks Kleft! Did you have to check each bar and then correct them individually? That would be a pain and possibly a deal breaker.
Kleft
Member
- Messages
- 56
- Likes
- 29
Thanks Kleft! Did you have to check each bar and then correct them individually? That would be a pain and possibly a deal breaker.
That would possibly be a deal breaker for me if I had to do that, the first chart I posted shows the options that I have for how the information is displayed, if I change how it is displayed my lines can be way off hence the differences between the two charts.
- Status
- Not open for further replies.