SLAyers' Notes

Status
Not open for further replies.
The later you enter, the higher your price risk, and any entry around here is very late.

By focusing on drawing the right DL, I missed this important fact completely. :cool:

Therefore, where and how will the market tell you that longs are in trouble? At what point or level is it more prudent to exit, stand aside, and let everybody work things out before you make another entry decision, and what can you do to ensure that you're focusing on the market and not on your own fears?

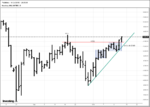
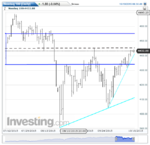
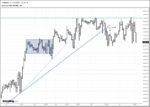
I think a good time to stand aside is if/when price stops trending and moves back into a range/chop. With that in mind, 4392 seems like an important level. A break (decisive?) below that level might be a good time to get out.

I realize price could drop into the middle of this range/chop and shoot back up, so exiting at 4392 may represent a risk averse approach. If we had entered into the current week-long uptrend sooner, then perhaps letting price fall back to the middle of the range/chop (at around our entry) would seem more palatable. Here, my instinct would be to take the profit.

By Monday, barring a significant disruption, the intersection will be about 30-40pts higher.

If we reach that point, I’d rely on the DL for an exit -- while keeping an eye on 4455 with the idea that a failure to get above it would be a bearish signal.

Thanks again.
 

Attachments

  • 10-16b.png
    10-16b.png
    44.6 KB · Views: 203
What bar interval are you using to manage this trade, even if it is just a hypothetical exercise?
 
Then we'll stick with that.

As regards your prior post, trendlessness is not a sufficient reason to exit and stand aside. Those who are new to trading price tend to freak when price stops going in the intended direction. They don't understand balancing, nor do they understand the need to "rest". And if they have a history of losing, they're terrified of giving back even a fraction of what they've been lucky enough to win.

But sometimes one has to give up a little in order to gain a lot, which is why it is far more important to focus on price than on one's trade. Note here for example that price evolved into a range, then rotated around the mean of that range. This went on for twenty-one hours. But then price broke out to the upside and gave another 34pts. (I'm using the hourly to illustrate what's going on inside the daily bar) Note the hard rejection of 4400. Nor does price come anywhere near the halfway level, much less the line. There is no reason to exit this trade other than fear, particularly as you're 50pts in profit (now about 75).
 

Attachments

  • 1016.gif
    1016.gif
    19.3 KB · Views: 229
As for "risk aversion", that is no longer a factor. You're 75pts in profit. There is no risk. Any concern about risk means that you're thinking about your trade, not about price behavior. Focus on and correctly interpret price behavior and the "risk" takes care of itself.

Granted, if one is new to this, these statements sound great but have little practical value if the trader's beginning to sweat. There is a middle ground, shown here again with the hourly and a tighter DL (this helps to highlight the difference between a demand line and a trend line). Yes, the tighter the DL, the sooner one will be "stopped out". And the tighter the DL, the more likely the trader will be to miss a continuation. But that's the cost of trading out of fear.

And here is where the trader has to do some grunt work. And he has to do it himself because the results will vary according to the instrument traded and the interval used.

Start by collecting at random twenty charts of whatever you're trading.

Plot the DLs (or SLs, if the trend is down).

Note where price breaks these lines.

Note what happens when price breaks these lines: does it move laterally or does it move in the direction opposite to the previous move?

If it moves in the opposite direction, at what point does the probability of a reversal increase and the probability of a continuation decrease? Once you know that, "instinct" is irrelevant. You have statistics on your side and can make reasoned decisions, not gut reactions arising out of fear. If the results are unclear with twenty charts, select another twenty. A hundred is more than enough.

Db
 

Attachments

  • 1016a.gif
    1016a.gif
    20.5 KB · Views: 210
Thanks for illustrating how the different intervals can be used together in managing a trade, something I'm finally beginning understand. I plan to dig more deeply into Wyckoff's market phases so as to avoid being "shaken out" and letting fear take over.

I've done some of the grunt work you mention on the five minute interval and will do so on the daily and hourly given this discussion.

Thanks for all the thoughtful feedback.:)
 
From the attic:

Remember first of all that daytrading is not the ultimate goal of every market participant. There is no generally-held belief that you have not arrived until you're a daytrader. Granted it all appears romantic and sexy, but it is primarily little more than busy. Playing World of Warcraft would keep you just as busy and it would be a lot easier on your pocketbook.

Keep in mind also that many of those who go on about the riches to be found in daytrading aren't actually trading, or, if they are trading, they are making little or no money (eventually they disappear, with or without fanfare, and one learns after a while not to pay a great deal of attention to the claims made on message boards).

Therefore, rid yourself of any notions that if you're not daytrading, you're not really trading. Traders can also trade daily charts, or even weekly. And if you can't be at your computer during the trading session, daytrading -- or intraday trading -- just may not be for you.

As you have experience with mutual funds, you know all about patience. And given your particular tax situation, frequent trading will likely generate more frustration than it's worth, certainly more than is necessary. Consider, then, a postponement of your trip to the real-time world as well as all the paraphernalia required to go there and work there. Once one has decided to make a big change, he naturally wants to get on with it, and as quickly as possible, which is why so many people go from the one extreme of long-term investing to the other extreme of intraday scalping. You appear to understand that there's more to it than buying a charting program, subscribing to a streaming datafeed, and opening a brokerage account. You also appear to understand that there is a process through which one must go, either now, fresh and with a clean slate, or later, after a string of disappointments and failures.

Therefore, at least entertain the idea of EOD (End Of Day) trading. Not only will this not require you to be in front of your computer all day every day, it will neither require you to wait an intolerable amount of time for your work to pay off. While some have compared EOD trading to watching concrete set, doing it the "Wyckoff way" is something different, waiting until just the right moment to take the trade, then reaping the benefits (or getting stopped out) almost immediately. Gringo, for example, proposed two trades in the EOD thread, one of which he took and one of which he didn't. But both ripened within only two or three days. For someone with a full-time job and family responsibilities, two or three days is a mere blip.

Of course, if you're desperate to daytrade, why not? The best way to learn what you're in for, and up against, is to try it. But if you have a life, and many things to occupy your time, you may find that EOD trading is just the thing. Far faster than the mutual fund route if you approach it as Wyckoff would, but without all the pressure and anxiety of intraday trading. The same principles apply, the same procedures, and often greater rewards.

And you don't even need a real-time feed.
 
From the attic:

Remember first of all that daytrading is not the ultimate goal of every market participant.

Ultimate goal: develop [or find] a way that truly suits your personality, perceptions, appetite, conditions and is consistently profitable.

Desperation, pressure and anxiety fade if your successful at that.
 
Last edited:
The NQ rise this time around closer to 4450 is stronger than it was last time. Notice how during the last trip price couldn't stay around this region for long (on daily) as demand buckled fast. This time around though demand hasn't been so quick in fading away.

The hourly is showing a cleaner demand line which makes things easier. I would be alert to any development of weakness but DL break (hourly) would be the first indication of anything resembling that. As things stand, there's nothing for me to do other than avoid unnecessary involvement.

Gringo
 

Attachments

  • NQ Daily.png
    NQ Daily.png
    29.4 KB · Views: 196
  • NQ Hourly.png
    NQ Hourly.png
    28.1 KB · Views: 188
Last edited:
The trade must be approached . . .

Db, I assume you're still holding the long, and will continue to hold it until a break of the demand line. If one had used the tighter trend line rather than the DL (discussed in post 85) then it looks like the exit would have been at around 730 this morning and meant giving up 25 extra points as of the close (as you warned).

If you don’t mind my asking one more question on all this... What is the meaning of the drawing of the runner skidding in front of the hurdle on the above daily chart? I see it’s placed above the 4451 level which is just about exactly today’s close and also the previous daily swing high and the mean of the daily May-July range. I suspect it's an indication of a likely reversal/congestion, which as it turns out seems to be what happened today. Assuming I'm understanding this correctly, nice call.

Thanks.
 

Attachments

  • 10-19.png
    10-19.png
    49.1 KB · Views: 177
If you don’t mind my asking one more question on all this... What is the meaning of the drawing of the runner skidding in front of the hurdle on the above daily chart? I see it’s placed above the 4451 level which is just about exactly today’s close and also the previous daily swing high and the mean of the daily May-July range. I suspect it's an indication of a likely reversal/congestion, which as it turns out seems to be what happened today. Assuming I'm understanding this correctly, nice call.

Potential R as it could turn into a double top if demand dries off.

Only after the fact we can determine, whether the area acted as R or whether price just went through it without much trouble. If it acts as an R then DL will nudge you to pay attention. In other words DL automatically gives us a signal that hey something happened that caused a potential change in stride.

Knowing the potential R in advance is another step to be more aware and even get ready for potential action. So you're in effect mentally getting ready in case DL breaks.

Notice how quiet I had been but suddenly as price approached a potential area have become more active with my posts. I have no clue whether price would weaken here but my job isn't to guess or predict, it's only to react according to my plan once DL breaks and there's a RET. Same old SLA and using it close to a potential R.

Gringo
 
Last edited:
Which interval do you look for the retracement and entry on? Hourly? Thanks.

Weekly -> Daily -> 5 hourly -> 1 hourly -> 30 min -> 15 min -> 5 min -> 1 min. All as needed. Generally speaking I wait for daily to line the ducks up. Then focus on how close I can enter after D/S line break and RET. Usually the D/S break is hourly and if I have time I go with smaller intervals instead of waiting for the hourly bar to close. Being close to a potential S/R gives the confidence to go smaller intervals especially when there's a clear rejection off of S/R or a drop back into it (screen time).

For you it would be advisable to keep the D/S lines in place (I keep them there!) so you don't have too much to worry about. Later as you keep on viewing this price behavior for some time you'll discover ways to enter a little earlier and reduce price risk a bit more using smaller intervals. You could also reduce size to avoid paying attention to smaller intervals. There are many ways to skin a cat.

Availability is a big thing and if one isn't able to see, it doesn't matter what interval one's planning to use. I have at times reverted to only daily intervals when time was in short supply. The only issue with it is that the price is already quite away from the danger point by the time the signal comes and if the move isn't large enough the risk goes up. But some of the largest moves do come off of the daily.

Knowing your own preferences will go a long way in making your life easier. I adapt to my needs and change things when practically they're not feasible even though may be lucrative.

Gringo
 
Last edited:
Much depends on whether or not one is available. If he isn't, then it may be the hourly or nothing.

Europeans have had the advantage on many occasions lately as the important moves have taken place while they're up and we're still in bed, e.g., this morning at 0300 NYT. Otherwise, one must just take what the market is willing to offer at whatever time the trader is available to trade, and if that's nothing, then so be it.

Ah, the hinge and breakdown at 400. I see it now -- on the 15, 5 and 1. Maybe I should rethink this sleep thing. :)
 
No hinge. Just hitting the wall at 4455. But there have been multiple ops to short at that level all morning.
 
TR keeps things in check.
 

Attachments

  • NQ 5 Hour.png
    NQ 5 Hour.png
    28 KB · Views: 218
TR keeps things in check.
Yeah, I thought the break and retracement on the hourly yesterday would be a good opportunity for a short for the following reasons:
-Price close to potential resistance of 4455.
-Price sitting on the DL of the daily.
-Clear break and retracement on the hourly.

Obviously, I missed something important. Was price not close enough to R? What did you see that kept you from jumping in?
 

Attachments

  • 10-21.png
    10-21.png
    63 KB · Views: 191
Review the AMT section of the book. One can't hang around and wait for RETs in a range. If he does so, he often ends up near the opposite side before it presents itself, as here, unless he shifts to a much smaller interval, which he can't do unless he's trading live.

Ranges are about reversals. The entries here are at the upper limit of the range. If one is uncomfortable trading reversals, then there are no trades. But given that price spends more time ranging than trending, at least in terms of how these are defined in the SLA, the wise trader becomes comfortable with reversals.

The trade today, for example, was the failure at 56. Either one takes it or he doesn't. But the fact of it doesn't change (see "The Price of Admission").
 
Status
Not open for further replies.
Top