You are using an out of date browser. It may not display this or other websites correctly.
You should upgrade or use an alternative browser.
You should upgrade or use an alternative browser.
- Status
- Not open for further replies.
YoungBuller
Junior member
- Messages
- 14
- Likes
- 0
See post 172 and work your way forward. That should answer your questions.
So you shorted near the median because it was a failure at the July high. And we just experienced another one.
Going back to those different channels I posted, I just want to confirm that as long as I was looking at one of those channels at the time I would have been alright for gauging OB/OS conditions.
dbphoenix
Guest Author
- Messages
- 6,954
- Likes
- 1,266
Due to questions and issues that have arisen recently, I've added something on timeframes to the book. It's too much to post: 12 pages. But the beginning of it may provide something to chew on while preparing for tomorrow's trading:
Trading opportunities: whether or not one takes them, they exist. Or existed at the time. Whether or not one didn’t or wouldn’t take them – out of inattention, fear (Appendix F, the SLAB), ignorance – does not change the fact of their existence (see, at the least, “Trading Opportunities”, p. 49, Notes). If one has not mastered the “primer”, i.e., the SLA/AMT as set forth in pp. 36 thru 57, he will not likely benefit from the rest of the book. That mastery is achieved by reading, study, practice, reviewing the charts and one’s efforts, and maintaining meticulous records of one’s notes (see in particular “Developing A Plan” and Appendices D and E in the SLAB as well as here in Notes). One must, in short, in order to take advantage of these opportunities, know what to look for and what to do with it if and when he finds it.
The struggling trader quickly comes to the conclusion that the best entry invariably occurred an hour ago. Or yesterday. Or two days ago. Or last week. He somehow never sees them in real time, either because he’s focused on himself (“where do I enter?”) rather than on price movement (see “A Final Note”, the SLAB, p. 33, again), or because he’s become entangled in defining “retracements”, for example, in excruciating detail due to his fears (Appendix F again) rather than focus on danger points (p. 65, Notes) and where he can enter based on those danger points and the number of ticks he’s willing to risk independent of whatever the bars “say”, or because he hasn’t prepared properly or thoroughly and though he may think he knows what to look for doesn’t know where to look for it (weekly>daily>hourly>etc). The trader who has studied the rules on p. 9 and the “Crib Notes” on p. 19 (the SLAB) and applied them to all the examples everywhere and still finds himself stuck in The Land of CouldaWouldaShoulda may find a leg up by understanding just who it is that he’s trading with (with, not against). Trading the auction market profitably requires more than a knowledge of how to draw a trend channel or box. One must also achieve some understanding of the participants. One of the more extreme examples is the scalper vs he who focuses on weekly charts. If the trader wants to hold something for more than a few minutes, much less a few hours or days, he must understand that focusing on the 5s chart is a waste of time and effort in that those who are also focusing on that chart or T&S display have no interest in hours and days. The trader who hasn’t thought out his goals thoroughly is therefore out of synch with the market from the getgo. This is not a recipe for success.
There is also the matter of Who’s Got The Money to consider. Scalpers are undeniably busy, but they don’t move markets. They’re not the ones who are attempting to support price as it falls. They are not the ones with the power to engineer sustained breakouts. They are not the ones who are creating those trend channels. If one then wants to trade with the flow of bigtime money, which is arguably a more efficient and profitable method of trading than swinging at shadows, then he needs to understand what bigtime money is looking at. If he can also acquire an understanding of what bigtime money is most likely to do with it, he’ll be in a far more secure position that just about every trader out there, including some of those who have bigtime money but don’t know quite what to do with it.
One must remember that the more obvious the movement, however it is displayed, the more people there are who will see it. Therefore, if one trades EOD using daily bars, he's going to have an awful lot of company. Everybody sees that. Everybody. But if he's trading 5-second bars, not so much. Therefore, he's more likely to take quick profits because the trading crowd he hangs around with is generally not in this for the long haul. This is NOT to suggest that each and every trade should – much less must – be taken off a long-interval chart: daily, weekly, whatever. The point is to be aware of what all the various players are focusing on and use that awareness to one’s advantage. Whether one is trading off a 5m chart, or a 15m, or an hourly, it pays to know what everyone else is looking at and enter at those points and levels where the larger group or groups is/are mostly likely to join in and propel the trader into profit. Trading in a vacuum is not only inefficient but generally unprofitable.
That not every group of traders is looking at the same thing is most easily understood by noting the level of trading activity: the fewer participants, the less activity; the more participants, the more activity (for the purpose of getting through this, we won’t quibble about the differences between transaction volume – number of transactions – and share volume – number of shares changing hands; in terms of price movement, it really doesn’t matter). In other words, if everybody is looking at the same thing, such as a major parabolic move, then everybody is trading and there’s tons of activity. But if the money players aren’t paying attention, aren’t interested (as they wouldn’t be in itty-bitty movements on a tick chart or T&S display), then there’s much less activity. When the little players notice the big moves that are initiated and sustained by the big players, they join in (if they’re smart; the stupid ones will short the upmoves and buy the downmoves in the fond belief that they’re smarter than they really are, thus adding fuel to the moves they’re taking the opposite sides of).
I'm also working on something regarding equilibrium. Considering the environment in which we're trading, it may provide food for thought and possibly keep the unwary out of trouble:
“Equilibrium”, “value”, “balance” have all been addressed in the SLAB and in Notes. Rather than go into all that again, I’ll depend on the interested reader to use Ctrl+F with any or all of these terms to brush up on what they are all about. As for those who are up to speed in this regard, I’ll begin by reiterating something I said in “Please Sir” in Notes.
Traders who have longer-term timeframes and traders who have shorter-term timeframes are fated to trade at cross-purposes only if the shorter-term traders don’t understand and accept that it is not they who are in charge. They just don’t have the money. And it’s money that moves markets. Shorter-term traders who understand that they are reactive will cultivate the patience to wait for those moments when traders trading more than one timeframe are all trading together and exploit that behavior for their own benefit. This dynamic can be seen most days when traders in more than one timeframe seek direction during the first thirty to ninety minutes. If nothing’s happening, they withdraw, and price drifts sideways for a while, sometimes for the rest of the day. The short-term trader who doesn’t understand what’s going on will try to force a trade out of this and will end up with little to nothing, or even a loss. The short-term trader who does understand what’s going on will sit on his hands and wait, and observe, and look for those clues which indicate that several categories of traders in several timeframes are on the same track and travelling the same train. This is most clearly seen during climactic highs and lows, when practically everybody is on the same track going the same direction but is also seen in the more low-key breakouts that often occur after extended sideways drifts during the morning session.
These sideways movements can drive the daytrader and short-term swing trader crazy. These sideways drifts were particularly common during the internet bubble, when big afterhours and pre-open moves would get daytraders all excited, but when the market opened for business, price just drifted sideways, even at a downward slant (making big money, or any money at all, was not quite the slam dunk you may have read it was).
These breakout/drift and drift/breakout phenomena occur frequently, sometimes more than once a day. It can seem to the unwary that somebody is trying to “trick” him. More likely he just doesn’t understand that he’s trading with others who are interested in different timeframes.
dbphoenix
Guest Author
- Messages
- 6,954
- Likes
- 1,266
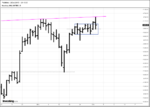
In the meantime, supply lines will help the trader keep track of what the longer-term people are doing. These cues -- such as if price were to reach 4740+/- -- may provide the trader with attractive trading opportunities.
Db
Today's high: 4739.50.
Attachments
Today's high: 4739.50.
And a return trip to the daily median.
Attachments
Today's high: 4739.50.
Db, your chart does not enlarge and it is blurry. Could you upload again please?
dbphoenix
Guest Author
- Messages
- 6,954
- Likes
- 1,266
I believe it's the same chart DB posted in # 263.
Correct.
Correct.
OK, thanks!
Gring0
Well-known member
- Messages
- 264
- Likes
- 128
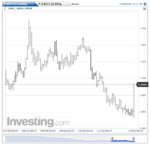
Even at least one forex instrument seeks equilibrium, and without clutter:
Cosmic alignment or a straight line?
Attachments
dbphoenix
Guest Author
- Messages
- 6,954
- Likes
- 1,266
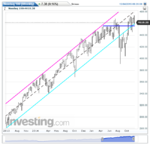
NQ Weekly.
Also worth noting that the LL of the wkly channel, the daily SL and the midpoint of the range that price has formed over the past month are all at the same level.
Db
- Status
- Not open for further replies.