stoploss please
Established member
- Messages
- 780
- Likes
- 10
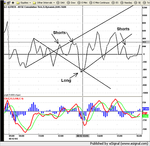
Simple posting of the Tick indicator and how it can help you stay on the right side of a move.
I have used breaks of tick trend line to help me time my moves.
What I have discovered is more rewarding is how the tick reacts after a trend line break.
What I look for is a bounce or failed break ema break as this signals that sentiment has changed and we are now moving in a new direction.
For the ease of reading, the attached chart of the tick just shows the tick average and entry points.