Simple Technical Analysis

David Knight

Established member
Messages
946
Likes
213
Simple Technical Analysis .

No waffle..

No voodoo...

No mumbo jumbo....

Just the good old fashioned simple stuff.

The kind that still works... because it just has to.


The stuff that was staring you in the face while you contemplated which rabbit hole to go down next.


You know,... before it got messed up by guys who talked a good game, but couldn't deliver.... and never will.

The trading 101 forgotten and abandoned in the search for something better; the really good stuff.

...............................<Welcome back. What took you so long? >


Attachments

  • 50%.gif
    50%.gif
    44.3 KB · Views: 419
  • 200MA.gif
    200MA.gif
    40.3 KB · Views: 367
  • BPSPX.png
    BPSPX.png
    14.2 KB · Views: 361
Friday February 9th 2018


Thursday Low (2580.56) is a 10.2% drop in just 10 days from the all time high (2872.87)


That is half way to a bear market. (-20%)


The NYSE BULL% (53.80) is ‘Bear Confirmed’ as of yesterday having been ‘Bear Alert’ at the start of the week.


The market is 100 points nearer the 200ma than it was at the low (2681.33) on Wednesday


That is the news for investors..


We are traders.


You have a trading plan. Trade according to your plan.


Staying flat is an option.


All that has changed is that ranges are wider, the moves are quicker, volatility has increased and bears are in control. (It happens sometimes...eventually)


The market was overbought. Now it is correcting- Normal.


Everybody was complacent and saying the same things they always say when the market grinds higher and higher.- Normal.


The bears had thrown in the towel.-Normal


Trump said he owned the rally. Now he owns the correction- Trumpish.


The media will say a correction is healthy (after all the ‘experts’ tell them a correction is healthy)- Normal.


Don’t bother listening to them if you are over 30. Go out of your way to avoid them if you are over 50.


The market will drop some more anyway.- Normal.


‘ Markets don’t change because people don’t change’


Period.


Remember the 'Fri factor' (see my journal) 'they' prefer Fridays not to be a heavy selling day...IF they can avoid it
 

Attachments

  • Screenshot (60).png
    Screenshot (60).png
    13.7 KB · Views: 308
  • 200ma.gif
    200ma.gif
    37.5 KB · Views: 302
Sunday February 11th 2018


Friday Factor

Regarding my comment to the ‘Friday Factor’ (where Friday is the least likely day to close heavily in the red ) the rule held true.

However, there was a twist in that the market first made a new low (2532.69), down 48 points from Thursday close, making a sharp reversal in the afternoon to close 38 points up on the day.

Sharp turnaround rallies in the afternoon such as these are typical bear market behaviour. It doesn’t mean we’re in a bear market, but it is definitely trading like one at the moment.
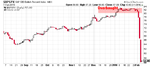
100 points nearer the 200MA’

Also, we saw a test of the 200MA which has held first time and where Fridays rally began. The last time the 200MA was tested was the November 2016 low. (See chart)

The 200 MA and Bull% indicators are (for me, in terms of context) the tools that are appropriate in the current situation, which is why this thread is going in the current direction.


Some History.

I took a look back at the significant market drops in August 2015 and Feb 2016 focusing on the 200SMA and $BPSPX


Chart-1

Three things to note with the drop in 2015 compared to the current market:


  1. The decline began when the market was much closer to the 200SMA
  2. The market had been in a sideways range for several months.
  3. The $BPSPX was highest in February (75.80) when the S&P 500 high in February was 2119.59, dropping to the low 50’s by August when the Index had only gained another 15 points. (The year high was 2134.72)


The next time you read ‘They don’t ring a bell at the top’, you might reflect on the difference between simple T.A. and studying the works of W D Gann in the hope that you can time market turns to the exact day.

Should you be bullish when a market is making no real headway while internal strength deteriorates from an over bought condition? Divergence.


2016 (Chart 2)

Note the divergence at the double bottom in Jan/Feb and the Bull%

Jan 1812.29 (23.40)

Feb 1810.10 (27.60)

A little higher, though still in the oversold zone but each day thereafter it climbs rapidly-

29.80- 35.80- 44.50- 46-50- 47.20- and 58.40 by the end of the month with price gaining 150 points.
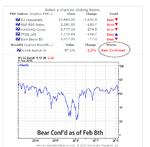

2017/8 (Chart 3)
The indicator gave a good overbought signal in March. It never got into the oversold zone.

This year the indicator was overbought in the low 80’s until the drop and closed at 40.40 on Friday.

You can’t expect one tool to answer all the questions. But I think it does a pretty good job at stopping you buying the tops and selling the bottoms. It also is a good balance to the argument that price alone tells you everything you need to know.


What Next?

What about this current drop? Is it over already/Is there more to come/Is it the start of another Bear market?

In terms of the Bull% it has already done it’s job. I wouldn’t base a trading decision on the current reading until/unless it drops into the oversold zone next.

For me, when it is at extremes, it is useful. Otherwise it stays in the tool box.

But if it should drop to oversold you could use that reading to attempt, to quote Warren Buffett, ‘be greedy where others are fearful’.
Something to keep an eye on.
 

Attachments

  • 200ma bull 2015.gif
    200ma bull 2015.gif
    47.7 KB · Views: 312
  • 200ma bull 2016.gif
    200ma bull 2016.gif
    46.5 KB · Views: 312
  • 200ma bull 2017.gif
    200ma bull 2017.gif
    44 KB · Views: 293
Last edited:
A simple 50% retracement.

T.A.

Working since markets began.
 

Attachments

  • 50.gif
    50.gif
    24.8 KB · Views: 309
Last edited:
You'll need some sort of understanding of T.A to work in the industry...apparently.
 

Attachments

  • Screenshot (53).png
    Screenshot (53).png
    61.3 KB · Views: 305
Kevin O’leary (I would suggest) explains how past performance is a good indicator of future results.


The 3 common factors for businesses that secured investment in the TV series Shark Tank were-


  1. They could summarize their business plan in 90 seconds.
  2. They could demonstrate why they were the best team to drive the business forward.
  3. They knew their numbers.


Not too far away from-


  1. Summarize your trading plan in one paragraph.
  2. Design/adapt a trading plan to suit your own situation and personality.
  3. Have a very good understanding of the market(s) you’re trading.


Could you convince the sharks that your trading plan is worth investing in?


Not, would you want to?


But, are you confident that your trading plan would stand up to the scrutiny and secure an
investment?


Good discipline to go through this exercise.

One of the really good things about using a traders' forum is that when you put an idea up here in a post, people are not afraid to take pot shots at it. Once it has had some sharp corners knocked off in this process, it is just all the stronger for it.
 
Top