Simple Inside Bars

Inside bar at 1300

12 range 15770 15819

13 range 15772 15819

As bar is through open both buy and sell live

Buy stop at 15823 stoploss 15768

Sell stop at 15768 stoloss 15823

5.3 lots (9679.15/3 = 293.07 / 55 = 5.32)

Sell triggered at 15768, trade in progress, other order cancelled
 
Trading much lower now, previous candle high is 15780 so stop moved to 15802 (15823-15780/2=42/2 =21.5)

Maybe should have had included a rule where stop to break even when R:R is greater than 2:1 to lock in a good move but for now we'll just have to stick to the 50% and hopefully we'll continue trading lower.
 
Unable to move stop any further as the previous bar did not make a lower low so our stop remains at 15802 for the night, hopefully markets will drift lower.
Maybe i need to introduce a rule to lock in some profits on a large move but for the moment we'll wait and see if the 50% works.

There was an inside bar on the 1500 candle but i said i wouldn't trade after 1500 so we'll let that one go.
 
Last edited:
Todays open at 6am is 15656

We're still i our trade and showing a profit. The 7am bar is making a lower low than the 6am so we will move our stop accordingly. The high is 15660 so 15802-15660 = 142 /2 = 71

New stop is 15731

We've now locked in a profit (in theory) and hope for the trade to run lower.


Exit will be on a reversal signal or when stop is hit.
 
THe 8am bar made a lower low (just 15566 vs 15569) so we can lower our stop again.

The high of the bar was 15643 (15731-15643=88 /2 =44) so our new stop is 15687

We have now locked in a profit of 90 pips which gives us a R:R of 1.63 so for (90/55)
 
No lower low for the 9am bar but we do have another IB

8am range 15566 - 15643

9am range 15575 - 15631

Sell stop placed at 15571

stoploss at 15635

4.5 lots (293 / 64 =4.57)

I have just taken the previous balance as no profit or loss has been banked yet.

Trade triggered almost immediately, lets see what happens....
 
The 10am candle made new lows so we can move our stops accordingly.

The high was 15625 so our original trade we move the stop to 15656 (15687 -15625 = 62/2 =31)

and our second trade to 15630 (15635-15625 = 10 / 2 =5)

I would not have been too keen to take the second trade seeing how far cable's already fallen without any pull back but we just have to follow the rules and see what happens
 
No lower lows but another inside bar

10am range 15625 -15507

11am range 15596 - 15527

So a sell stop at 15523

stoploss at 15600

3.8 lots (293/77=3.8)

Order cancelled at 1pm if no trade

All other stops stay the same.

I don't have much hope for this trade succeeding if triggered but we can but try.
 
Our trade was not triggered and cable has gone above our stop so the order is cancelled.

The other two stops will stay where they are as no lower lows.
 
Hi ,

you do a great job. Please, would you give some draft summatized values (#win, #loss, %wins or...) of your strategie.

jore
 
Thanks for the pointer Foredog. I'll try to check it out. THINK i've got an inkling of what Ampro's advising; would it work on shorter time frames -- 5 mins, 1 hour, stuff like that?
 
Stopped out of our 2nd trade (short @ 15571) at 15630 for a 59 pip loss per lot, 4.5 lots = - $265.5 or 2.72% of our account

we were almost stopped out of the original short as well, coming within 2 pips! Just made a lower low at the close of candle so we'll move the stop accordingly:

Candle high 15589 so new stop (15656 -15589 = 67 / 2 =33.5 so round to 34) 15622
 
Last edited:
New lows again so we can move our stop down further

Candle high 15508 so stop to 15565 (15622-15508 = 114 /2 = 57)

We've now locked in 203 pips so thats 3.69% R:R if we get stopped out.

A shame that we got stopped out on the other trade but thats what happens sometimes.

So far we've taken 3 trades

- $230.85
- $265.50
+$1075.9 (If stopped out)

so our running total is
+ $579.55
 
  • Like
Reactions: BSD
6am open 15430

Loks like we could potentially be out of our trade today, Cable is above the open at the moment.

Exit will be if stop is hit or if an inside bar forms for a long our stop will move to 4 pips above the IB, eg the trigger for a long trade
 
No lower lows but another inside bar

10am range 15625 -15507

11am range 15596 - 15527

So a sell stop at 15523

I guess you were aware of the vicinity of the weekly IB on & around your 60min analysis conclusion?

Nice when you get the opportunity to marry up one or two common technical themes, especially if the fundamental flavor is also playing ball ;)

$ bullish slant continuing to be honored, clearly visible via the lower top steps on your hourly sheet as price vibrates towards the late October low magnet @ c1.5250

Weekly view:

wmck6u.jpg


60min view:

5v4tg0.jpg
 
Hi foredog,
Any chance of a chart - perhaps at the conclusion of the trade showing entry and exit? A picture paints a thousands words, as evidenced so well by Hawkmoon's and Ampro's posts.
Keep up the good work - the thread is developing nicely.
Tim.
 
Hawkmoon's second 60 minute chart provides a good example of the failed breakout that I mentioned in an earlier post. I've added a red trend line just to emphasize the point that the trend is down. As inside bars / candles are essentially continuation and reversal patterns, it's possible that someone might see this inside bar (IB) and think 'aha, trend reversal'. On it's own, there isn't enough evidence to support this view, nonetheless, let's run through the scenario where a trader plays this to the long side. I prefer to enter on the breach of the 'holding bar' (HB), i.e. the bar prior to the (IB) - the green line on the chart. I would then expect price to breach the red trend line and, when it not only fails in this endeavor but, is duly rejected by it, I would suspect a failed break out. Price then closes back inside the high / low range of the HB - my cue to exit the trade for a loss. After a failed breakout to the upside heralding a reversal, the probability of trend continuation and a break down to fresh lows increases exponentially. Sooner or later, price HAS to do one or the other. It's tried the first option and failed, so success at the second is now much more likely than it otherwise would have been. The long trade was pretty speculative with little to support it but, now, the short trade has a whole confluence of evidence to back it.
Tim.
PS. For very conservative traders who only want to take the very best and cleanest of set ups, there's an arguement for requiring a failed breakout / break down in the pattern before entering a trade. This will greatly reduce the overall number of trades but, as in this example, it should greatly improve the success ratio of winners to losers. Alternatively, another option might be to reduce ones position size where there's no failed breakout / break down and to increase position size where there is. Just a thought!
 

Attachments

  • Hawkmoon's_Chart.jpg
    Hawkmoon's_Chart.jpg
    29.7 KB · Views: 430
Last edited:
Shows what i know, The 7am bar made new lows at the close, so we can move our stop down.

New stop 15524 (15565 - 15483 = 82 / 2 =41)

New lows again 8am bar

Stop to 15487 (15524 - 15451 = 73 /2 =36.5 so round to 37)

I'll post a chart when i get the chance to copy one from IG and annote it.
 
Another new low so we can move our stop again

New stop 15441 (15487-15396= 91 /2 =46.5 (47))

Having trouble posting a chart, too big apparently....
 
As inside bars / candles are essentially continuation and reversal patterns, it's possible that someone might see this inside bar (IB) and think 'aha, trend reversal'. On it's own, there isn't enough evidence to support this view...

Alternatively, another option might be to reduce ones position size....

You make some valid points in your post, particularly regards the confirmation aspect of playing counter moves. The sizing option (on any strategy play) is a very important, yet under rated tool in most quarters. You get an awful amount of power on a move by feeding into a positive run.

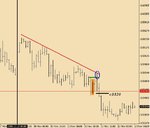
If you look outside of the inside bar trigger for a minute & mark out the major & minor potential reaction zones on your template sheets, you can better estimate where the stops & order flow balance points are at.

Price (pound bull momentum) will definitely need to re-engage & consolidate the bias steps outlined on that hourly sheet before mounting any serious challenge on the 4 hour minor ceiling @ 1.5880 & beyond.

You might experience cleaner & more advantageous opportunities setting up on your favored lower timeframe IB trigger if you wait until price shows it’s hand first on & around the key level zones, rather than executing via the inferior action inside these barriers.

Value v/s cost is a key consideration when totting up your bottom line at the end of each month, particularly if you’re running a short-timeframe book.

As long as players continue to book profits on moves thru key support zones & sell into rallies at these lower top markers, then the momentum will keep you honest & allow you to honor the intent via your preferred trigger.

I don’t know how you fella's handle or play potential reversals as price pops thru the gears on kickbacks, but I like to see prior zones (be they key swings or higher timeframe s/r camps) overwhelmed & consolidated (break & re-test) before laying bets on counter moves.

But then, those types of plays usually require a whole different set of tools before you can settle back into playing inside-outside bar triggers.

foredog: apologies for clogging up your journal with this stuff - I'll butt out & allow you to continue with your work. I like the fact your content is free of all that indicator garbage. Keep it clean & you'll keep it honest ;)

35apykw.jpg


15zqcec.jpg
 
Top