Sierra Charts and misleading trendlines.

F

ford

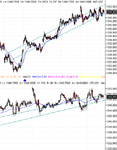
I have noticed that Sierra chart decides by itself some times to change the angles of trendlines in what appears to be a 'best fit'.

Now that's all very touching and thoughtful of the program but if you like me have put on trendlines for a reason and they change and you dont know, it can be misleading and costly.

I thought I'd warn people here and see if I could get some answers as to whether there is a setting somewhere hidden within the program that will stop Sierra from doing this? :(

Regards..
 

Attachments

  • sierra-broken.png
    sierra-broken.png
    29.5 KB · Views: 834
Looks to me that Sierra hasn't changed anything.
Seems you have stretched (or shrunk) the window horizontally. When you do that the angles change.
If they didn't, the lines would end up in the wrong place.
Glenn
 
dont really get the point of this sort of trend line stuff, but anyway, surely best fit means what it says - and it might change as the latest data comes in - or if you change the amount of data you are looking at

just get a best fit and do a standatd trendline over it and clear the best fit?
 
I have to disagree with Glenn as I've noticed this irksome tendency as well.

That top line isn't just on a different slope in the second chart it's in a different place entirely - e.g to match the first chart it should cut through near the tops of those last three highs (preceding the last minor hi at 1050) not the bottoms. No idea what to do about this though I'm afraid ford.
 
OK Frugi - I haven't experienced the problem as you describe. The only other possibility I can think of is that the upper trend line is one which has not been completed by clicking it's right-hand end, so it will wander about with the mouse until it's fixed in place.
Otherwise - interesting - I'll look out for the problem.
Regards
Glenn
 
Glenn, the windows were the same size when photographed, it was just the level of zoom that has changed.

Stevet, I've not read anywhere in the Sierra documentation that trendlines are adjusted by the program for best fit, I was commenting that it *appears* that is what the program was doing.

I don't quite understand what you mean by you dont see the point in this type of trendline, that is besides the point, I was using these lines purely as an example of how Sierra changes the lines.

sb1.PNG

sb2.PNG
 
Sorry I think I was looking at the wrong line before, but on your bigger chart the deviation on the bottom one is now plain to see in those wee circles. Guess it may be just an annoying fault with the rendering/graphics programming?
 
No idea about the technicals behind it sadly.. :cheesy: I'll fire off an email to the Sierra maker and see what (s)he makes of it.. Just thought a heads up for other Sierra users out there was obligatory of me..
 
ford

so you just did a normal trend line and then it moved - i can tell you that thing like that are major issues with charting companies - i have some that cost thousands a year - and there are still issues with them -

because of a comment by someone on here about sierra - and my negativity to people trying to become big time traders - and trying to do it on the cheap - i did take a look at sierra - and frankly - it blew me away - it is very very good and for the money -its unbelievable - as long as you can deal with the data issues

so if you are going to complain to them - take it softly - at least it dont cost you thousands while they sort it out !
 
Ford


Which version of SC are you using -- it's the number that appears after SierraChart on the top line of the window?

It looks as if you may have drawn a trend channel (introduced in release 39) which may be calculated from a ssingle drawn line (I've got release 38 so I'm guessing here). I have always found the Extending Trendlines completely reliable. What type of trendline are you drawing?

L
 
Hi Lorenzo di Zenzo,

I'm currently using version 38 also, and the lines are simply 'extending trendlines'.
 
Very strange. Perhaps if you save the settings as a chartbook and e-mail it to SC with your data file and the screen shot they can throw some light on it.

Let us know what they say.

Good luck

L
 
Top