The Basics of Trading
I've had a long running thread on the T2W boards giving an introduction to the central themes of trading. This series of articles has been adapted from that thread and will take you through all the areas you need to get a start in trading, from chart reading to defining a strategy.
In Part 1 I will look at:
Part 2 will then consider:
And finally, in Part 3, I will bring it all together by taking you through a simple trading strategy.
Basic Chart Reading
Ok let's start with the basics of chart reading and deal with Support, Resistance and Trendlines. This really is the core basics of trading, and in my view is the foundation of a trading strategy.
How Candlesticks are constructed.
There are 3 types of bars that can be used for charting. A line chart (which connects the
closing prices), a bar chart and a candlestick chart.
A bar or candlestick chart will show the high, low, open and close for a set period (so on a daily chart, one bar represents one day). The high and low data is very important, so we can not use a line chart as this information is left out and only the closing prices are shown.
There is no real difference between a bar or candlestick chart - they both show the same data so it's personal preference. However, as you move further on in your trading career, you will find that candles offer more information, but for the moment, I'm dealing with the basics of trading.
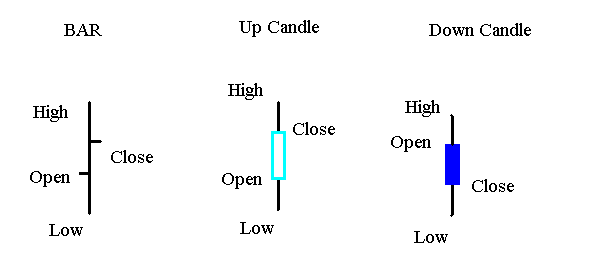
The above just shows how a bar or candle is created. The up candles have light or hollow "bodies", whereas down candles have dark or filled "bodies."
Ok, time to look at the more technical aspects of trading, support, resistance and trendlines.
Support
Support is a level on a price chart, that price hits and finds a large amount of buyers, and hence the price starts to rise again
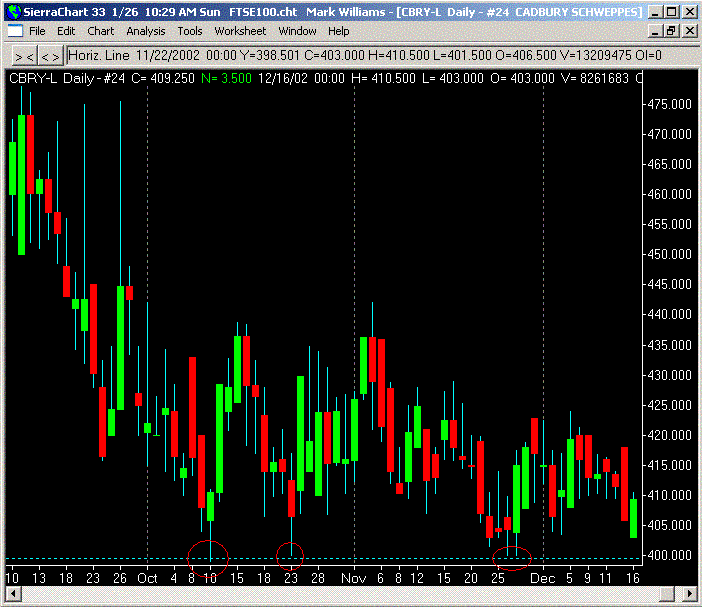
On the chart above of Cadbury's you can see that every time price hit 399 / 400, it found enough buyers to force the price up.
Resistance
Resistance is the level at which a price chart struggles to break above. When price hits a resistance level, the number of sellers is strong (as they know that the next move is down), and it takes a lot of buying pressure to get it above this level.
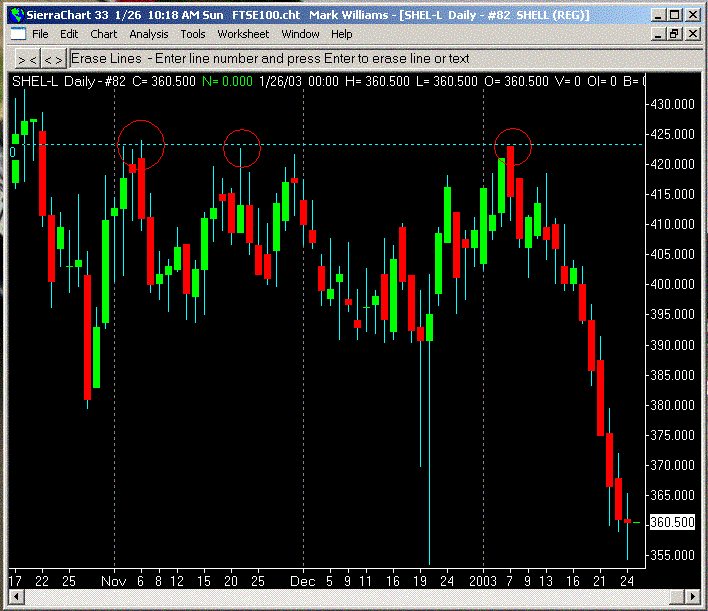
On the above chart you can see that there were a large number of sellers at 423, which was too strong for the buyers to push through.
Trendlines
Trendlines are made by connecting 3 or more points along the same line. They either connect the tops of the highs together or the bottoms of the lows. Trendlines work because everyone sees them and know that the next time price hits that level, a reversal should happen, so they either rush to buy or sell depending if it is an uptrend or downtrend.
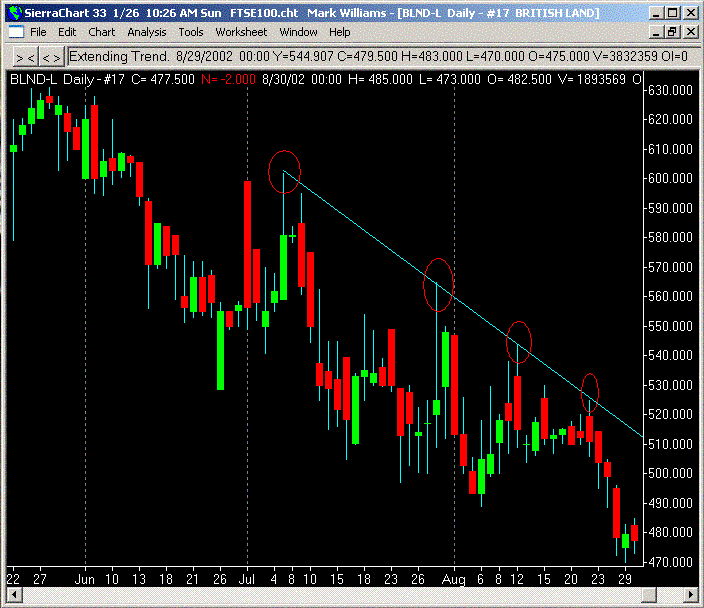
On this chart I have connected the highs together to create the straight line (or trendline). This is a downtrend because the trendline is pointing down.
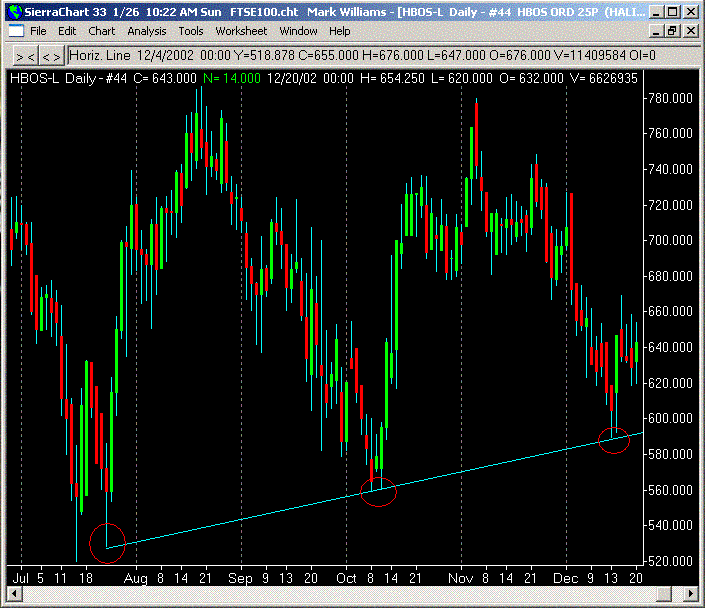
On this chart I have connected the lows together, and as the lows are rising, it is in an uptrend.
...and that's pretty much the foundation to trading. I know it sounds simple (and many of you would all ready know this), but it works and that is the main thing.
Now we will move on to look at money management.
Money Management
At this point, I would like to show you the solution to trading. The hidden secret that will change your life forever, and this is it:

Money Management
This is nothing new, but few new traders use money management wisely and get "killed" because of it. There is a myth among new traders that you HAVE to be right more times than wrong. This table is one that I've taken from "The Master Swing Trader" by Alan Farley:
What the table shows is that to be profitable, or more profitable, you can either work on being right more often, or reducing the losses. Most new traders will let their losses run and run, which means the trades that follow must be right to claw back the money they have lost.
This is a table that Chris Manning displays, and it really shows the importance of cutting your losers
It shows that the higher the loss, the significantly higher % gain it takes just to get back to square one.
The most effective way of controlling your trades is to look at the risk / reward ratio of the trade before you enter into it. This is done by setting a rough price target, and knowing the position of your stop. From this you can then work out the risk / reward ratio, for example
Current price = 100
Target = 109
Stop = 97
Reward = 9 points
Risk = 3 points (including commission).
Giving a 3:1 ratio
Knowing where to place the stop is a difficult thing, but the rule of thumb is that the stop is placed at the point the chart tells you "you are incorrect" Most people (including myself) rarely take anything less than a 3:1 ratio, especially for stocks. A 3:1 ratio means that you only have to be right 25% of the time to break-even.
Once you are in a trade, one of 3 things can happen. Either your stop gets hit, the price moves sideways or the price moves into profit. The first 2 you can't really do much about, but when a price moves into profit, then you move the stop to lock in some profit. This is an art form in itself.
The important thing is to make sure that at any one point, the risk should not be equal or greater than the reward. In the above example, if the price went to 105, and we didn't move the stop we would have this scenario.
Current price = 105
Target = 109
Stop = 97
Reward = 4 points
Risk = 8 points
Giving a 1:2 ratio
A 1:2 ratio is very poor. This is where moving the stop to lock in profits really comes in. If we move the stop to 102, we lock in 2 points worth of profit and have the following risk / reward
Current price = 105
Target = 109
Stop = 102
Reward = 4 points
Risk = 3 points
Giving a 1.3:1 ratio, which is a lot better than the 1:2 ratio we had earlier.
Moving stops, and stops placement is very difficult, but I will deal with this later.
Ok, so lets take a closer look at a real chart and see how the Risk / Reward profile can be used.
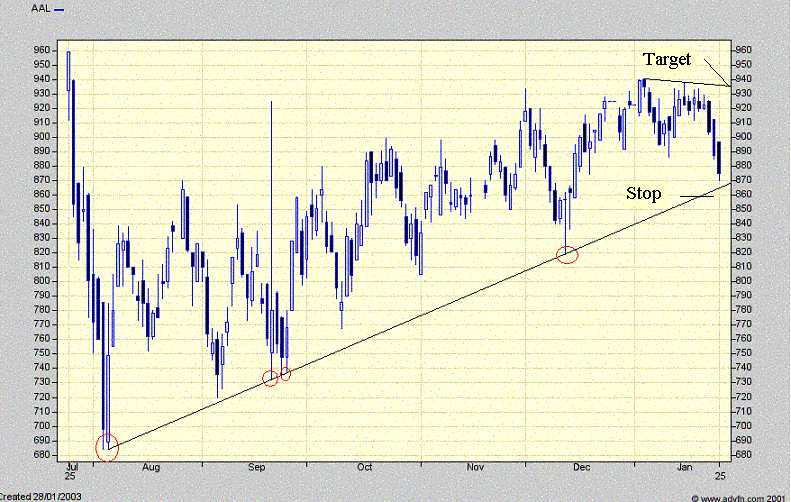
Here we have a chart of AAL (Anglo American):
Current price = 874
Target = 930
Stop = 859
Reward = 56 points
Risk = 15 points
Giving a 3.73:1 ratio, which is good enough for me.
The other aspect of money management is the stake size. I know a few traders whose stake size is too large for the account they are trading. The important thing, especially when you are first starting out, is to make sure that you "stay in the game" as most of your learning will come when you're actually trading.
The accepted level of risk among the professional traders and the trading authors is 1% of your capital on every trade. I used to trade with 2% risk, but that was far too much, and it still scares me today to think that I actually had that level of risk!! When your risk increases, any bad run that you have will be magnified beyond your control. To make sure you stay within your risk profile, work out how many points you are risking, how much 1% of your trading capital is and from that work out the stake size, so that if your stop is hit, you will only lose 1% of your trading capital.
Now we will move this one step further and look at exiting a losing trade.
Exiting A Losing Trade
As demonstrated from the table above, cutting a loss is really important, to do this we will use a stop-loss. Knowing where to place a stop, is one of the hardest things to know. There are so many factors that come into play, like the volatility of the instrument that you are trading, your risk tolerance...etc
Stop-losses are an important part of trading. I've said it before, when you are learning to trade, the important thing is that you "stay in the game" long enough to put what you have learnt to good use. Stop-losses save you money, they don't make you money. There will be many times as a trader, your stop gets hit, and your closed out of a trade only to look back later to find that you would have made an absolute fortune. This happens in trading, and at times like this you must remember that the stop loss is there to protect your capital.
The point at which you are incorrect.
The general acceptance is that your stop is placed at the point at which you are told that you were wrong / incorrect. Most of the time it will be a break in a trendline, or a point of support / resistance that has broken.
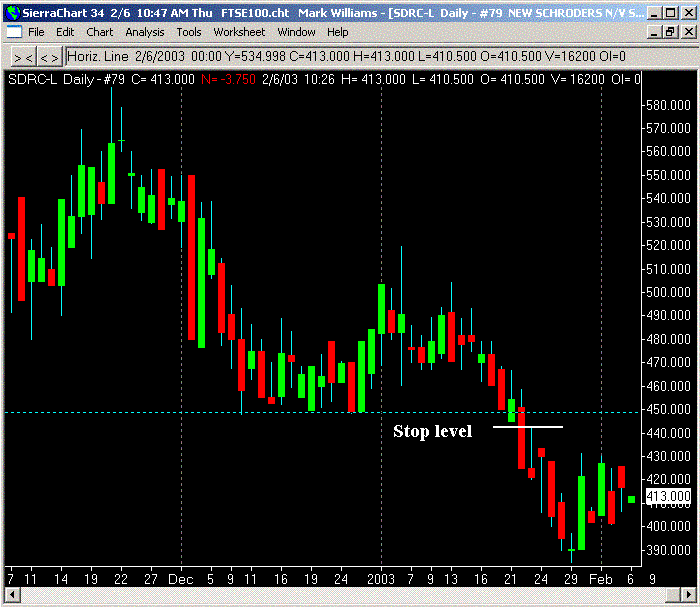
With this example of SDRC, the support was at 450, and the natural place for the stop-loss was about 445. The support failed, the stop got hit and the price carried on lower. At 445 the price has violated the support line, so you would expect the price to fall further, which is what happened in this case.
The trader versus the market makers.
The unfortunate matter is that the market makers know where the stops are. They know because most people trade the same way. There are plenty of occasions when a market maker will go "gunning" for stops. What I mean by this is that they drop the price below support, to get the stops hit and then the price carries up, up and away.
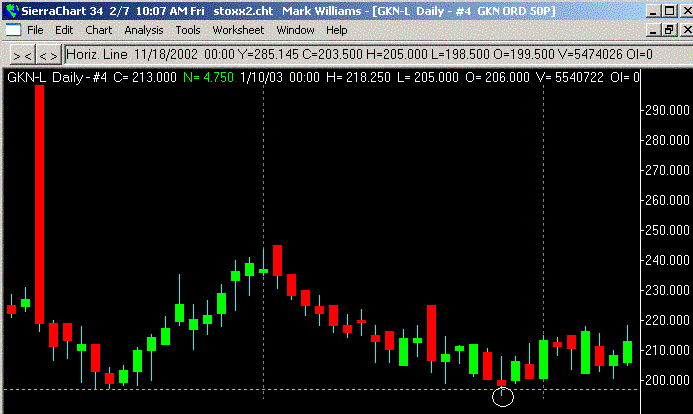
This GKN chart shows how the price fell below support at 197, hit 195 and then reversed. If you had placed a tight stop at 196, you would have been stopped out.
The only way to combat this is to allow the price a bit of room to move once the support / resistance / trendline has been broken, that way any stops that get gunned won't be yours. How much you let the price move around is down to personal preference, but YOU MUST KNOW THE POSITION OF YOUR STOP BEFORE YOU ENTER the trade, this includes the room for manoeuvre, and should be part of the risk calculation that we talked about earlier.
Mid-trade stop-losses.
I talked earlier about moving the stop-loss so that at any point in the trade, the risk does not exceed the reward. Moving your stop during a trade must only be used to lock in profits. If you move the stop loss to increase your risk, you are asking for trouble.
Moving a stop to protect your profits, the stop should be placed under the last support for a buy or last resistance for a short. On an end of day chart you might look for the last low to act as the support, or the last high as the resistance, for example.
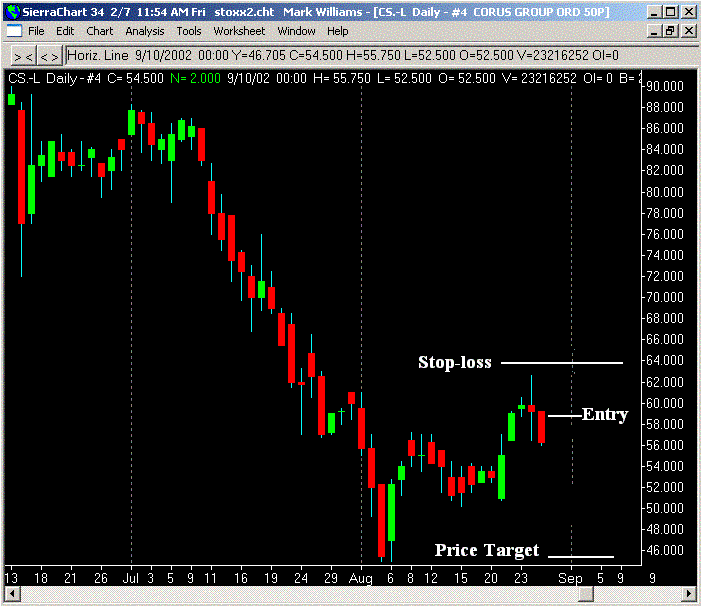
If we enter this Corus trade, short at 59, with a stop-loss at 64 and a price target of 45.
Risk = 5
Reward = 14
Reward / Risk ratio = 2.8:1
Now if the chart does this...

At the current price of 52, and leaving the stop where it is, we would have this scenario
Risk = 12
Reward = 7
Reward / Risk ratio = 1:1.7
At this point we have more risk than reward. So the logical place to put the stop is at 57, as this is the last significant high, giving...
Risk = 5
Reward = 7
Reward / Risk ratio = 1.4:1
Which is better than the 1:1.7 ratio.
Moving stop-losses to protect profits is just that, taking the profits that are on offer.
Stop loss placement is difficult and takes time to master, but as long as you remember the fact that stop-losses protect your capital, the emotional side of trading should be easier to follow.
Next we will look at setting price targets.
Setting Price Targets
We've already looked at stop-loss setting and risk / reward analysis. The other part is of course price target setting.
Your price target (as with the stop-loss) is governed by the time scale you're trading in and how long you expect to hold the shares.

This ALLD has 3 levels of resistance
322 - January support
363 - October and December support
420 - High of January and also resistance in early September and back further.
The short term target is 322, which as I say is the January support. It's the short-term target for 2 reasons, 1) It's the closest to the current price and 2) There is enough resistance to hold it on a short-term basis (the resistance was only valid for a week), and for a short-term trade, we would expect it to get there pretty quickly.
he medium term target of 363 would take longer to get to than the short-term target, but that's what you would expect. For 363 to be hit, it will have to take out 322 and although you would expect price to stop there, it wouldn't hold it back long enough to be a problem.
The long term target will have to get through both the short-term and medium-term resistance, but as we are prepared to hold it in the portfolio for a while, that is not a problem.
Target setting comes down to how strong you think support and resistance is at the various stages. The text books say that the more often a level is tested and the longer the period it is tested over, the stronger it becomes.
Choosing how long you are going to hold shares for, is a very individual thing and take many years to figure out what suits you best. Having an idea of how long you're planning to hold your shares though should decide your target.
That is pretty much it for target setting. The only other thing to realise is that changing the target is no different to changing a stop-loss. There must be good reasons for doing it and it can be adjusted as time goes on and the chart develops. Just remember that a stop-loss MUST NOT be changed to add risk, but to protect profits where suitable.
Read part 2 of this series.
I've had a long running thread on the T2W boards giving an introduction to the central themes of trading. This series of articles has been adapted from that thread and will take you through all the areas you need to get a start in trading, from chart reading to defining a strategy.
In Part 1 I will look at:
- Basic chart reading
- Money management
- Exiting a losing trade
- Setting a price target
Part 2 will then consider:
- The importance of discipline
- Paper trading
- The trading plan
And finally, in Part 3, I will bring it all together by taking you through a simple trading strategy.
Basic Chart Reading
Ok let's start with the basics of chart reading and deal with Support, Resistance and Trendlines. This really is the core basics of trading, and in my view is the foundation of a trading strategy.
How Candlesticks are constructed.
There are 3 types of bars that can be used for charting. A line chart (which connects the
closing prices), a bar chart and a candlestick chart.
A bar or candlestick chart will show the high, low, open and close for a set period (so on a daily chart, one bar represents one day). The high and low data is very important, so we can not use a line chart as this information is left out and only the closing prices are shown.
There is no real difference between a bar or candlestick chart - they both show the same data so it's personal preference. However, as you move further on in your trading career, you will find that candles offer more information, but for the moment, I'm dealing with the basics of trading.

The above just shows how a bar or candle is created. The up candles have light or hollow "bodies", whereas down candles have dark or filled "bodies."
Ok, time to look at the more technical aspects of trading, support, resistance and trendlines.
Support
Support is a level on a price chart, that price hits and finds a large amount of buyers, and hence the price starts to rise again

On the chart above of Cadbury's you can see that every time price hit 399 / 400, it found enough buyers to force the price up.
Resistance
Resistance is the level at which a price chart struggles to break above. When price hits a resistance level, the number of sellers is strong (as they know that the next move is down), and it takes a lot of buying pressure to get it above this level.

On the above chart you can see that there were a large number of sellers at 423, which was too strong for the buyers to push through.
Trendlines
Trendlines are made by connecting 3 or more points along the same line. They either connect the tops of the highs together or the bottoms of the lows. Trendlines work because everyone sees them and know that the next time price hits that level, a reversal should happen, so they either rush to buy or sell depending if it is an uptrend or downtrend.

On this chart I have connected the highs together to create the straight line (or trendline). This is a downtrend because the trendline is pointing down.

On this chart I have connected the lows together, and as the lows are rising, it is in an uptrend.
...and that's pretty much the foundation to trading. I know it sounds simple (and many of you would all ready know this), but it works and that is the main thing.
Now we will move on to look at money management.
Money Management
At this point, I would like to show you the solution to trading. The hidden secret that will change your life forever, and this is it:

Money Management
This is nothing new, but few new traders use money management wisely and get "killed" because of it. There is a myth among new traders that you HAVE to be right more times than wrong. This table is one that I've taken from "The Master Swing Trader" by Alan Farley:
| %Win | Trades | Avg win | Avg loss | Profit |
| 75% | 100 | £800 | £2000 | £10,000 |
| 50% | 100 | £800 | £600 | £10,000 |
| 25% | 100 | £800 | £133 | £10,000 |
What the table shows is that to be profitable, or more profitable, you can either work on being right more often, or reducing the losses. Most new traders will let their losses run and run, which means the trades that follow must be right to claw back the money they have lost.
This is a table that Chris Manning displays, and it really shows the importance of cutting your losers
| % Loss | % Gain needed to break even |
| 10% | 11% |
| 20% | 25% |
| 50% | 100% |
| 100% | 400% |
It shows that the higher the loss, the significantly higher % gain it takes just to get back to square one.
The most effective way of controlling your trades is to look at the risk / reward ratio of the trade before you enter into it. This is done by setting a rough price target, and knowing the position of your stop. From this you can then work out the risk / reward ratio, for example
Current price = 100
Target = 109
Stop = 97
Reward = 9 points
Risk = 3 points (including commission).
Giving a 3:1 ratio
Knowing where to place the stop is a difficult thing, but the rule of thumb is that the stop is placed at the point the chart tells you "you are incorrect" Most people (including myself) rarely take anything less than a 3:1 ratio, especially for stocks. A 3:1 ratio means that you only have to be right 25% of the time to break-even.
Once you are in a trade, one of 3 things can happen. Either your stop gets hit, the price moves sideways or the price moves into profit. The first 2 you can't really do much about, but when a price moves into profit, then you move the stop to lock in some profit. This is an art form in itself.
The important thing is to make sure that at any one point, the risk should not be equal or greater than the reward. In the above example, if the price went to 105, and we didn't move the stop we would have this scenario.
Current price = 105
Target = 109
Stop = 97
Reward = 4 points
Risk = 8 points
Giving a 1:2 ratio
A 1:2 ratio is very poor. This is where moving the stop to lock in profits really comes in. If we move the stop to 102, we lock in 2 points worth of profit and have the following risk / reward
Current price = 105
Target = 109
Stop = 102
Reward = 4 points
Risk = 3 points
Giving a 1.3:1 ratio, which is a lot better than the 1:2 ratio we had earlier.
Moving stops, and stops placement is very difficult, but I will deal with this later.
Ok, so lets take a closer look at a real chart and see how the Risk / Reward profile can be used.

Here we have a chart of AAL (Anglo American):
Current price = 874
Target = 930
Stop = 859
Reward = 56 points
Risk = 15 points
Giving a 3.73:1 ratio, which is good enough for me.
The other aspect of money management is the stake size. I know a few traders whose stake size is too large for the account they are trading. The important thing, especially when you are first starting out, is to make sure that you "stay in the game" as most of your learning will come when you're actually trading.
The accepted level of risk among the professional traders and the trading authors is 1% of your capital on every trade. I used to trade with 2% risk, but that was far too much, and it still scares me today to think that I actually had that level of risk!! When your risk increases, any bad run that you have will be magnified beyond your control. To make sure you stay within your risk profile, work out how many points you are risking, how much 1% of your trading capital is and from that work out the stake size, so that if your stop is hit, you will only lose 1% of your trading capital.
Now we will move this one step further and look at exiting a losing trade.
Exiting A Losing Trade
As demonstrated from the table above, cutting a loss is really important, to do this we will use a stop-loss. Knowing where to place a stop, is one of the hardest things to know. There are so many factors that come into play, like the volatility of the instrument that you are trading, your risk tolerance...etc
Stop-losses are an important part of trading. I've said it before, when you are learning to trade, the important thing is that you "stay in the game" long enough to put what you have learnt to good use. Stop-losses save you money, they don't make you money. There will be many times as a trader, your stop gets hit, and your closed out of a trade only to look back later to find that you would have made an absolute fortune. This happens in trading, and at times like this you must remember that the stop loss is there to protect your capital.
The point at which you are incorrect.
The general acceptance is that your stop is placed at the point at which you are told that you were wrong / incorrect. Most of the time it will be a break in a trendline, or a point of support / resistance that has broken.

With this example of SDRC, the support was at 450, and the natural place for the stop-loss was about 445. The support failed, the stop got hit and the price carried on lower. At 445 the price has violated the support line, so you would expect the price to fall further, which is what happened in this case.
The trader versus the market makers.
The unfortunate matter is that the market makers know where the stops are. They know because most people trade the same way. There are plenty of occasions when a market maker will go "gunning" for stops. What I mean by this is that they drop the price below support, to get the stops hit and then the price carries up, up and away.

This GKN chart shows how the price fell below support at 197, hit 195 and then reversed. If you had placed a tight stop at 196, you would have been stopped out.
The only way to combat this is to allow the price a bit of room to move once the support / resistance / trendline has been broken, that way any stops that get gunned won't be yours. How much you let the price move around is down to personal preference, but YOU MUST KNOW THE POSITION OF YOUR STOP BEFORE YOU ENTER the trade, this includes the room for manoeuvre, and should be part of the risk calculation that we talked about earlier.
Mid-trade stop-losses.
I talked earlier about moving the stop-loss so that at any point in the trade, the risk does not exceed the reward. Moving your stop during a trade must only be used to lock in profits. If you move the stop loss to increase your risk, you are asking for trouble.
Moving a stop to protect your profits, the stop should be placed under the last support for a buy or last resistance for a short. On an end of day chart you might look for the last low to act as the support, or the last high as the resistance, for example.

If we enter this Corus trade, short at 59, with a stop-loss at 64 and a price target of 45.
Risk = 5
Reward = 14
Reward / Risk ratio = 2.8:1
Now if the chart does this...

At the current price of 52, and leaving the stop where it is, we would have this scenario
Risk = 12
Reward = 7
Reward / Risk ratio = 1:1.7
At this point we have more risk than reward. So the logical place to put the stop is at 57, as this is the last significant high, giving...
Risk = 5
Reward = 7
Reward / Risk ratio = 1.4:1
Which is better than the 1:1.7 ratio.
Moving stop-losses to protect profits is just that, taking the profits that are on offer.
Stop loss placement is difficult and takes time to master, but as long as you remember the fact that stop-losses protect your capital, the emotional side of trading should be easier to follow.
Next we will look at setting price targets.
Setting Price Targets
We've already looked at stop-loss setting and risk / reward analysis. The other part is of course price target setting.
Your price target (as with the stop-loss) is governed by the time scale you're trading in and how long you expect to hold the shares.

This ALLD has 3 levels of resistance
322 - January support
363 - October and December support
420 - High of January and also resistance in early September and back further.
The short term target is 322, which as I say is the January support. It's the short-term target for 2 reasons, 1) It's the closest to the current price and 2) There is enough resistance to hold it on a short-term basis (the resistance was only valid for a week), and for a short-term trade, we would expect it to get there pretty quickly.
he medium term target of 363 would take longer to get to than the short-term target, but that's what you would expect. For 363 to be hit, it will have to take out 322 and although you would expect price to stop there, it wouldn't hold it back long enough to be a problem.
The long term target will have to get through both the short-term and medium-term resistance, but as we are prepared to hold it in the portfolio for a while, that is not a problem.
Target setting comes down to how strong you think support and resistance is at the various stages. The text books say that the more often a level is tested and the longer the period it is tested over, the stronger it becomes.
Choosing how long you are going to hold shares for, is a very individual thing and take many years to figure out what suits you best. Having an idea of how long you're planning to hold your shares though should decide your target.
That is pretty much it for target setting. The only other thing to realise is that changing the target is no different to changing a stop-loss. There must be good reasons for doing it and it can be adjusted as time goes on and the chart develops. Just remember that a stop-loss MUST NOT be changed to add risk, but to protect profits where suitable.
Read part 2 of this series.
Last edited by a moderator:
