In part 1 of this article, I looked at some of the basic elements of trading, including chart reading and money management. In this second part, I will consider some other essential issues, such as the need for discipline in trading and the importance of practice and planning.
The Importance of Discipline
I have previously mentioned why it is important that you DON'T move a stop-loss to increase risk, and I wanted to go through the "what if" scenario of letting a stop run.
We'll take this example from Barclays from January 2003.
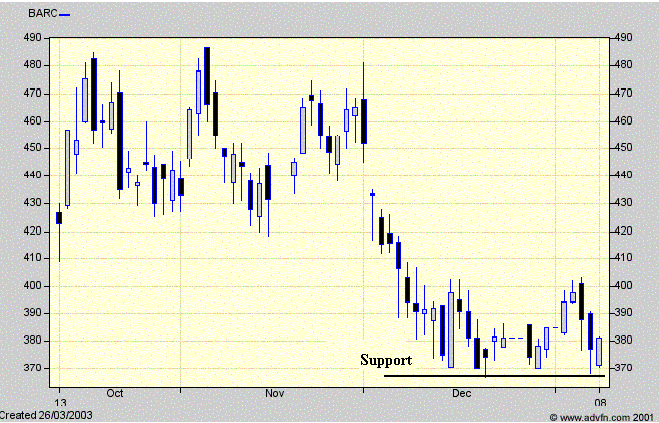
Here we have a nice double (or even triple) bottom on support, and a clean bounce up. You take this long entry with a tight manual stop at 360.
This is what happens over the days to come...
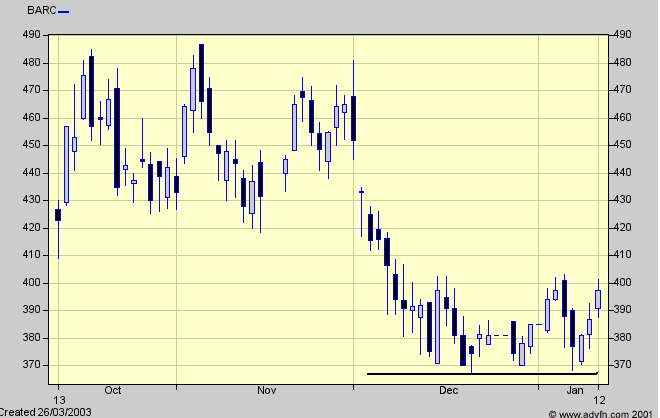
Brilliant, straight into profit and looking good.
The following week isn't so promising though...
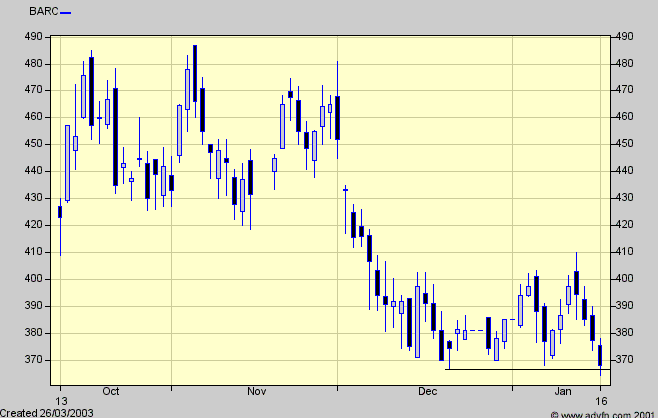
You hear yourself saying,
"Ok the price has gone through support, but it's ok, it closed above support so it'll be ok."
So you leave it for a bit, and this happens...
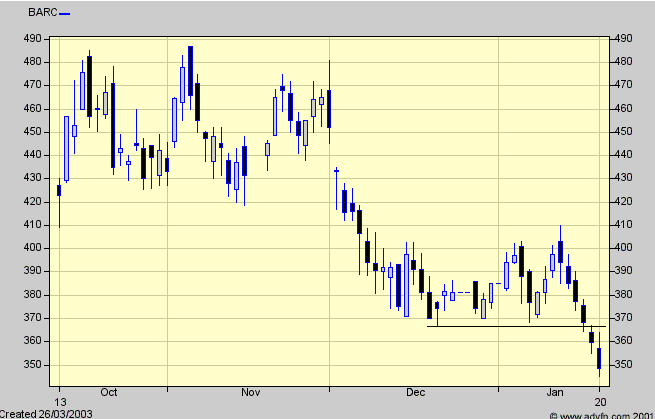
"Oh no the price has gone through support, ok it's too late to sell now, I'll wait until price gets back up to the support line."
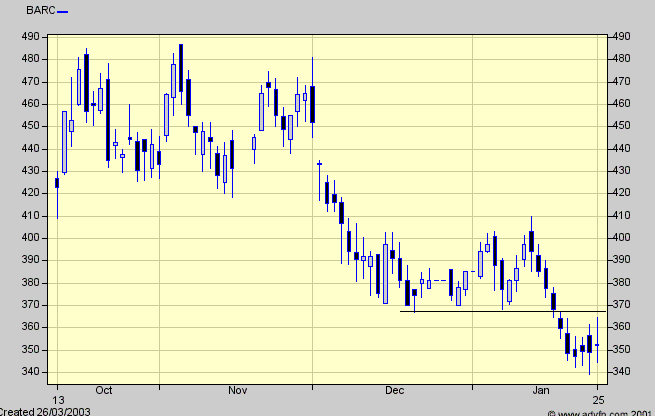
"Now price has made a nice rounded bottom so the next move is up, I can let it run for a while longer as it's bound to go through the resistance level."
and the next thing you know price does this...
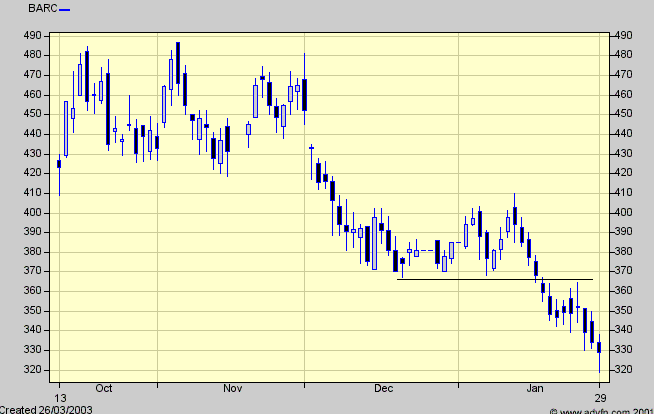
"Time to sell out and accept the loss."
Well it's good to know you cut the loss - some 35 points or 10% below where you should have done.
It's very easily done this, and I'm sure most traders have done this at some point in their trading career. This is why discipline is such a large part of trading. Always remember to move a stop to protect profits NOT to increase risk.
Now, we will look at putting in practice all that we have learned...
Paper trading
So far we've covered, the basics of support, resistance and trendlines, money management and the concepts behind risk and reward, price targets and stop loss placement. That is pretty much the basics behind trading, so the next step is to start putting this knowledge to use.
If you are looking at end of day charts, then the learning process of trading can be a slow one, after all you have to wait a complete day for a new piece of data.
The best way to practice is to go back over old charts and try to analyse it from there. I was once told: "practice doesn't make perfect - but perfect practice, now that's perfect." So I would like to spend some time going over how I've analysed data in the past. This should really help the learning process along:
Take a stock or a chart that you don't know anything about, and pick a time 2 or 3 years ago. This way you have no idea of what has happened in the past, and therefore you cannot cheat. You then analyse the chart you have, and then forward the data one day at a time. This will create a new bar and from that you will have another bit of data to decide whether to trade or act on.
If you're using the Sierra Chart package then you can use the right arrow key to jump one day at a time. There is a function on ADVFN to view a set date range. From there what you have to do, is change the "To date"
Lets have a look at this example: Barclays, 5 May to 5 Nov 1997
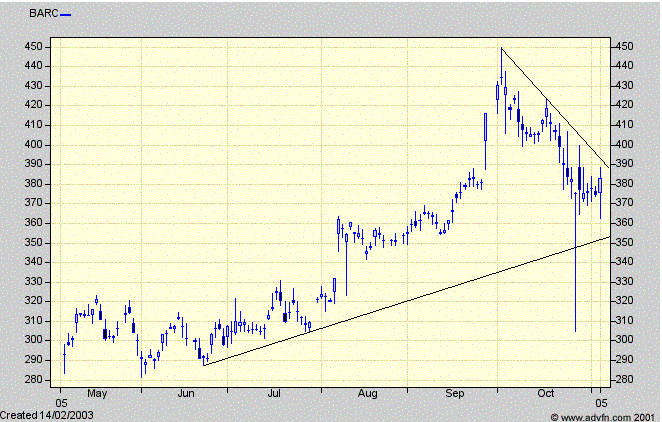
At this point I can't see anything in the BARC chart that I like, so I'll jump a day at a time until I see a set-up I like.
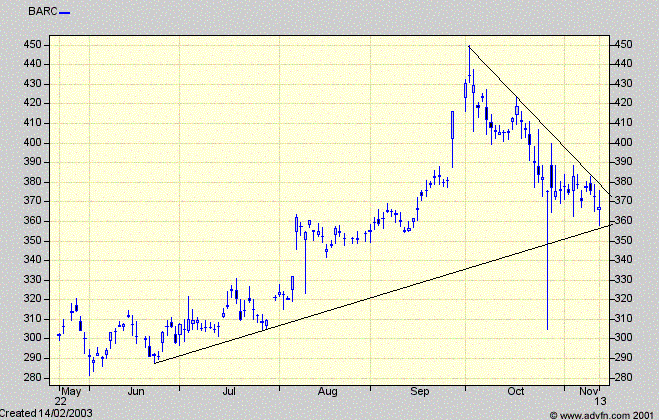
Ok, this has bounced between the downtrend and the uptrend, so there could be something to watch here
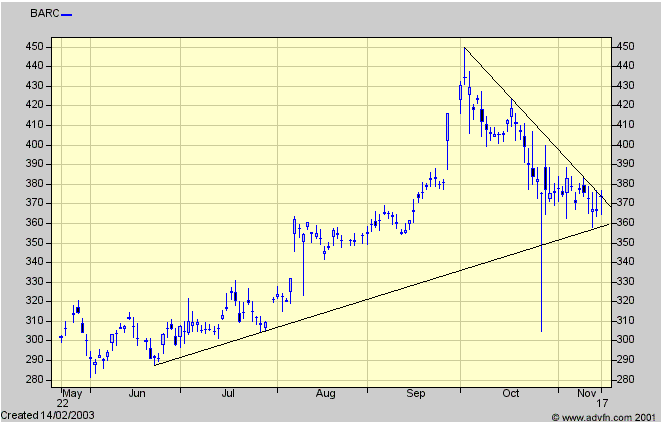
A couple of days later the downtrend has gone, so at this point I looking to buy and use the uptrend as support. - I'll wait another day to see if I can get a better entry.
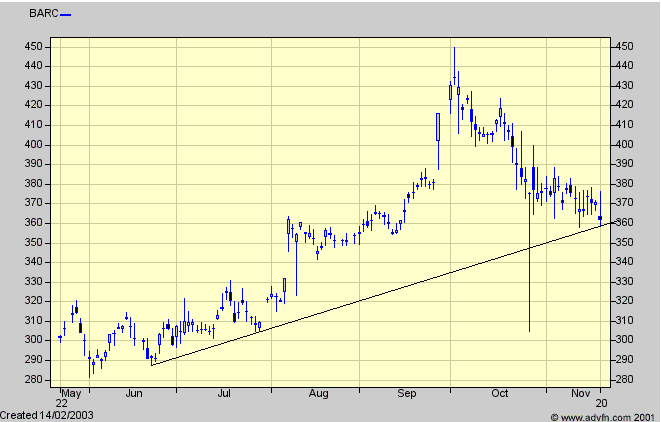
Now the chart has tested the uptrend, I'm happy to go long. So I'm long at 362 with a stop below the trendline at 355 and a target of 400 (which is the support in October). This gives a risk / reward of 5.43:1
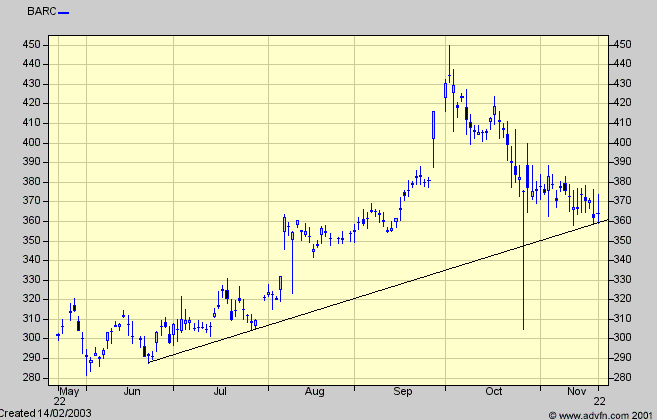
One bar later and the trendline is still holding price, so I need to go one bar at a time until I see something of interest.
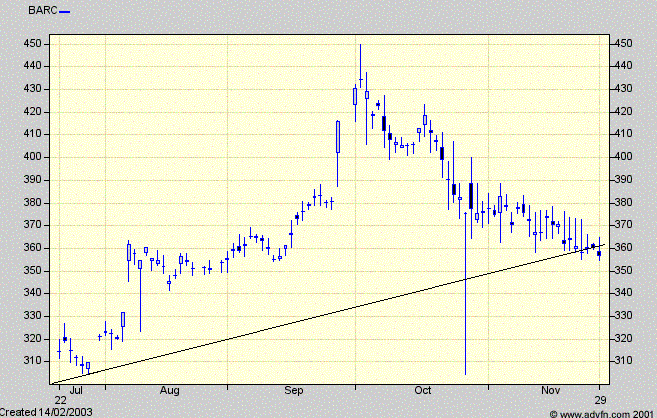
Oh dear. The trendline was broken and I was stopped out for -7 less any commission. Now I've got to look back at the chart again and see if there is anything I should have seen or done differently. In this case, I should have waited to see a solid bounce off the trendline before entering. I should have also seen the short-term downtrend which if broken would have been an indication that the price would be moving up.
And that's how to practice trading. Simple really, but if you do it properly, you can practice as if in real-time without having to wait days for each new set-up.
Now we will look at building a trading plan...
The Trading Plan
Building and using a trading plan is an essential part of trading. Without a suitable plan of action, it is highly unlikely that you will be able to create consistency in your trading.
Your plan should be clearly written, so that at any point before, during and after a trade, you should know what to do. This will make trading a lot easier and a lot less stressful - there can be nothing worse than looking at a losing position and not knowing where to get out, or how big the loss is going to be.
There are a number of elements that make up a good trading plan and it will be different for every trader. Here are the most important elements:
Which markets?
It may sound obvious, but which markets are you going to trade and are you able to trade them? It's no good deciding to trade the UK markets on a day-trading basis if you're doing a full-time job during the day. You also have to ask yourself "What advantages does this market have over the other options I have available?".
Who am I going trade through?
How are your trades going to hit the market? Will you use a spreadbetting company, a CFD account or a traditional broker? Which has the greatest advantages and do they have the level of service you require? Some people might find that spreadbetting offers the best deal for trading, but it might not be best for everyone.
Entry criteria
This is where things have to be detailed:
% Risk of capital on any trade
I make sure I do not risk more than 1-2% of my trading capital on any single trade. Any more than that and you risk a large drop in your account if you hit a bad patch or drawdown in your trading. Are you prepared to have more than one position open at any one time? Having more than one position open can get confusing on a short-term basis but for longer-term traders it's the most efficient way to trade.
Exit Criteria
As I mentioned earlier, there can be nothing worse than looking at a losing position and not knowing where to get out, or how big the loss is going to be. The exit criteria can take many forms:
What charting set-up
Which time-frames are you going to be looking at. This table will give you an idea of what charts you should be looking at:
Are there any indicators you look at?
Testing
Are you going to test the above strategy by paper trading, simulating or are you happy to go straight in and trade from the start. I would advise paper trading any strategy to make sure it works. Some look great on paper, but when it comes to actually trading they are not actually workable.
Time to change the trading plan
How long will you give the trading plan before you start to amend it? If you start changing a plan too early, you will risk not giving it a chance. Give it too long though, and you risk draining your account with a plan that isn't working.
The question above are ones that you SHOULD WRITE DOWN. I'm sure you can think about them in your head, but when it comes to the crunch, you need to be able to look at a piece of paper that tells you what to do - it shouldn't need much thinking about. These questions are the minimum that I would have as part of a strategy, you might find that there are other areas that I haven't talked about, but you still want them in your strategy. Great, the more detailed you can make it the better.
I'm often asked how long should you paper trade for? The answer is, it's a balancing act. You are balancing the need for understanding a trading plan with the need to trade for real. There is no getting away from the fact that real trading is very different to paper trading, for a start the emotional difference is massive and the risk with paper trading for too long is that you can get into a comfort zone, which makes the next step to real trading significantly harder. How long is really up to you, but my advice would be that as soon as you are happy with the plan, plan a couple more trades and then start trading for real.
When it comes to trading for real, make sure you start small. As I've mentioned before, your aim in the earlier stages of your trading career should be to stay "in the game", there will be plenty of time to increase the stake size once you have traded profitably at the lower stakes for a time.
In Part 3 of the article we'll look at a basic trading plan that I have successfully traded in the past.
The Importance of Discipline
I have previously mentioned why it is important that you DON'T move a stop-loss to increase risk, and I wanted to go through the "what if" scenario of letting a stop run.
We'll take this example from Barclays from January 2003.

Here we have a nice double (or even triple) bottom on support, and a clean bounce up. You take this long entry with a tight manual stop at 360.
This is what happens over the days to come...

Brilliant, straight into profit and looking good.
The following week isn't so promising though...

You hear yourself saying,
"Ok the price has gone through support, but it's ok, it closed above support so it'll be ok."
So you leave it for a bit, and this happens...

"Oh no the price has gone through support, ok it's too late to sell now, I'll wait until price gets back up to the support line."

"Now price has made a nice rounded bottom so the next move is up, I can let it run for a while longer as it's bound to go through the resistance level."
and the next thing you know price does this...

"Time to sell out and accept the loss."
Well it's good to know you cut the loss - some 35 points or 10% below where you should have done.
It's very easily done this, and I'm sure most traders have done this at some point in their trading career. This is why discipline is such a large part of trading. Always remember to move a stop to protect profits NOT to increase risk.
Now, we will look at putting in practice all that we have learned...
Paper trading
So far we've covered, the basics of support, resistance and trendlines, money management and the concepts behind risk and reward, price targets and stop loss placement. That is pretty much the basics behind trading, so the next step is to start putting this knowledge to use.
If you are looking at end of day charts, then the learning process of trading can be a slow one, after all you have to wait a complete day for a new piece of data.
The best way to practice is to go back over old charts and try to analyse it from there. I was once told: "practice doesn't make perfect - but perfect practice, now that's perfect." So I would like to spend some time going over how I've analysed data in the past. This should really help the learning process along:
Take a stock or a chart that you don't know anything about, and pick a time 2 or 3 years ago. This way you have no idea of what has happened in the past, and therefore you cannot cheat. You then analyse the chart you have, and then forward the data one day at a time. This will create a new bar and from that you will have another bit of data to decide whether to trade or act on.
If you're using the Sierra Chart package then you can use the right arrow key to jump one day at a time. There is a function on ADVFN to view a set date range. From there what you have to do, is change the "To date"
Lets have a look at this example: Barclays, 5 May to 5 Nov 1997

At this point I can't see anything in the BARC chart that I like, so I'll jump a day at a time until I see a set-up I like.

Ok, this has bounced between the downtrend and the uptrend, so there could be something to watch here

A couple of days later the downtrend has gone, so at this point I looking to buy and use the uptrend as support. - I'll wait another day to see if I can get a better entry.

Now the chart has tested the uptrend, I'm happy to go long. So I'm long at 362 with a stop below the trendline at 355 and a target of 400 (which is the support in October). This gives a risk / reward of 5.43:1

One bar later and the trendline is still holding price, so I need to go one bar at a time until I see something of interest.

Oh dear. The trendline was broken and I was stopped out for -7 less any commission. Now I've got to look back at the chart again and see if there is anything I should have seen or done differently. In this case, I should have waited to see a solid bounce off the trendline before entering. I should have also seen the short-term downtrend which if broken would have been an indication that the price would be moving up.
And that's how to practice trading. Simple really, but if you do it properly, you can practice as if in real-time without having to wait days for each new set-up.
Now we will look at building a trading plan...
The Trading Plan
Building and using a trading plan is an essential part of trading. Without a suitable plan of action, it is highly unlikely that you will be able to create consistency in your trading.
Your plan should be clearly written, so that at any point before, during and after a trade, you should know what to do. This will make trading a lot easier and a lot less stressful - there can be nothing worse than looking at a losing position and not knowing where to get out, or how big the loss is going to be.
There are a number of elements that make up a good trading plan and it will be different for every trader. Here are the most important elements:
Which markets?
It may sound obvious, but which markets are you going to trade and are you able to trade them? It's no good deciding to trade the UK markets on a day-trading basis if you're doing a full-time job during the day. You also have to ask yourself "What advantages does this market have over the other options I have available?".
Who am I going trade through?
How are your trades going to hit the market? Will you use a spreadbetting company, a CFD account or a traditional broker? Which has the greatest advantages and do they have the level of service you require? Some people might find that spreadbetting offers the best deal for trading, but it might not be best for everyone.
Entry criteria
This is where things have to be detailed:
- Are you looking to buy low and sell high (swing trading) or buy high and sell higher (momentum trading)? What will get you into the market?
- Are you looking for a test of support to hold price up, or are you happy to get in mid-move? What will be the factor that confirms whether you take the trade or not. For example, you might be looking for the general index to be moving higher, or might be looking for some sort of indicator to signal a move in your favour is imminent.
- Does the trade you are about to take have a good risk / reward ratio? I would be reluctant to take any trade with less than a 3:1 R/R ratio.
- How are you going to place your trade? Are you going to use limit orders or market orders to get you in?
% Risk of capital on any trade
I make sure I do not risk more than 1-2% of my trading capital on any single trade. Any more than that and you risk a large drop in your account if you hit a bad patch or drawdown in your trading. Are you prepared to have more than one position open at any one time? Having more than one position open can get confusing on a short-term basis but for longer-term traders it's the most efficient way to trade.
Exit Criteria
As I mentioned earlier, there can be nothing worse than looking at a losing position and not knowing where to get out, or how big the loss is going to be. The exit criteria can take many forms:
- Are you going to set a stop-loss in the market or use a mental one? I would always advise using a stop in the market if you can.
- Are you going to use a trailing stop and lock in profits when you can or take them off the table when offered?
- Are you looking to exit at your price target or just tighten the stop?
- Are you going to scale the position out (selling out bit by bit) or take everything off the table in one go?
- How long are you looking to hold the trade open for? Are you looking to sell in hours, days, weeks, months or years from now?
What charting set-up
Which time-frames are you going to be looking at. This table will give you an idea of what charts you should be looking at:
| Type of Trader | Holding Period | Chart to Trade Off |
| Tick Trader | Minutes | Tick / 1 minute |
| Day Trader | Less than a day | 1-5 minute |
| Position Trader | Hours / Days | 15-60 minute |
| EOD Trader | Weeks / Months | Daily |
| Long Term | Years | Weekly / Monthly / Yearly |
Are there any indicators you look at?
Testing
Are you going to test the above strategy by paper trading, simulating or are you happy to go straight in and trade from the start. I would advise paper trading any strategy to make sure it works. Some look great on paper, but when it comes to actually trading they are not actually workable.
Time to change the trading plan
How long will you give the trading plan before you start to amend it? If you start changing a plan too early, you will risk not giving it a chance. Give it too long though, and you risk draining your account with a plan that isn't working.
The question above are ones that you SHOULD WRITE DOWN. I'm sure you can think about them in your head, but when it comes to the crunch, you need to be able to look at a piece of paper that tells you what to do - it shouldn't need much thinking about. These questions are the minimum that I would have as part of a strategy, you might find that there are other areas that I haven't talked about, but you still want them in your strategy. Great, the more detailed you can make it the better.
I'm often asked how long should you paper trade for? The answer is, it's a balancing act. You are balancing the need for understanding a trading plan with the need to trade for real. There is no getting away from the fact that real trading is very different to paper trading, for a start the emotional difference is massive and the risk with paper trading for too long is that you can get into a comfort zone, which makes the next step to real trading significantly harder. How long is really up to you, but my advice would be that as soon as you are happy with the plan, plan a couple more trades and then start trading for real.
When it comes to trading for real, make sure you start small. As I've mentioned before, your aim in the earlier stages of your trading career should be to stay "in the game", there will be plenty of time to increase the stake size once you have traded profitably at the lower stakes for a time.
In Part 3 of the article we'll look at a basic trading plan that I have successfully traded in the past.
Last edited by a moderator:
