You are using an out of date browser. It may not display this or other websites correctly.
You should upgrade or use an alternative browser.
You should upgrade or use an alternative browser.
should i exit
- Thread starter Oraclefusions
- Start date
- Watchers 7
Oraclefusions
Junior member
- Messages
- 47
- Likes
- 3
Here is the chart
http://i45.tinypic.com/9rr9sh.png

Please note the following.
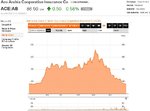
1. This is a new IPO launched and it has only been two days as you can see the x-axis - 18 and 19 dec, hourly chart (every hour for the trading session)
2. The launch price was 10 and its has been up journey. Question is will it continue to move based on what? usually two things happen based on my prev exp of IPOs. Prices are higher in the first week or two until they are stablized or for some IPO, they continue and get stablaized at much higher price than launced price. This is a new very good company here by the way.
Cheers
http://i45.tinypic.com/9rr9sh.png
Please note the following.
1. This is a new IPO launched and it has only been two days as you can see the x-axis - 18 and 19 dec, hourly chart (every hour for the trading session)
2. The launch price was 10 and its has been up journey. Question is will it continue to move based on what? usually two things happen based on my prev exp of IPOs. Prices are higher in the first week or two until they are stablized or for some IPO, they continue and get stablaized at much higher price than launced price. This is a new very good company here by the way.
Cheers
I may have read Trader333 intentions incorrectly, however, for others to read it would be nice if:
You got rid of all those indicators, RSI, Stoch Oscillator, QStick, and the ones that are all over the price (Bollinger band is it?), because it makes it hard to see what's going on.
In the post above Trader333's post, you have a chart, and so much of the volume is on the first bar, that you can't differentiate the rest of the volume clearly - it all looks the same.
In your most recent post, the top chart is nice as you can see the volume (but would be nicer to get rid of all the other indicators as mentioned).
In the lower chart of your most recent post, there's only 11 bars. Are they all a full hour, or is the first or last hour of trading 30 mins? Could you perhaps put up a 5 minute chart if possible (again without indicators on price, just volume and price).
Oraclefusions
Junior member
- Messages
- 47
- Likes
- 3
Further analysis on volume (you got me thinking that all you need is price and volume)
One strangge behaviour in the following chart (happened yesterday 18th between 14:30 to 15:00 hrs . The Candlestick shows price coming down, while the MACD indicator and the PVT both going in the upward(bullish) direction, does this means this signals that the price will come up?
Watch the same on 19th at around just before 15 hrs. the price goes down and so as the MACD and so as the PVT indicating money flowing out of the market.
Why two different behaviour of MACD and PVT aginst same Price down action?
http://i49.tinypic.com/33ac782.png
M
malaguti
Further analysis on volume (you got me thinking that all you need is price and volume)
One strangge behaviour in the following chart (happened yesterday 18th between 14:30 to 15:00 hrs . The Candlestick shows price coming down, while the MACD indicator and the PVT both going in the upward(bullish) direction, does this means this signals that the price will come up?
Watch the same on 19th at around just before 15 hrs. the price goes down and so as the MACD and so as the PVT indicating money flowing out of the market.
Why two different behaviour of MACD and PVT aginst same Price down action?
I wouldnt be looking to add the MACD to your analysis if I were you. It can be useful when considering divergence to indicate possibly the trend is slowing down, but from all the experience i've had, the trend can continue on and on. just look at where your macd is crossing, its so late its incredible. As Shakone commented, take off all your indicators, and read the price action. higher highs, higher lows...lovely uptrend
Oraclefusions
Junior member
- Messages
- 47
- Likes
- 3
Reading the price action based on candlestick charting is really interesting.
I read the following, what do yo think?
1. lots of spinning tops in the middle and around price up and also where price went down, indicting investors are taking exta precaution? because this indicates indecisive market yet cautiosly movin up the price?
2. There are two occassion where you see a long white bullish bar indicating exponential buying but then the buy and sell happens in the middle to slightyl upper part of that bar, like a swing from top to bottom and then back to top and a bit of break out?
So far from these two days what do you make up of the mood of the investors, whats are the possibilities fromhere and what I should look for if I will invest tomorrow at the start of day?
I wouldnt be looking to add the MACD to your analysis if I were you. It can be useful when considering divergence to indicate possibly the trend is slowing down, but from all the experience i've had, the trend can continue on and on. just look at where your macd is crossing, its so late its incredible. As Shakone commented, take off all your indicators, and read the price action. higher highs, higher lows...lovely uptrend
M
malaguti
Reading the price action based on candlestick charting is really interesting.
I read the following, what do yo think?
I think candlestick charting is pretty useless also. Happens occasionally where a hanging man has indicated the end of a trend, I'll show you twice as many where it hasn't. I dont subscribe to the idea that one candle, or two or three can tell me that CIT is about to develop.
brewski1984
Senior member
- Messages
- 2,067
- Likes
- 355
You're trying to do far too much with too many indicators that tell you different things. As said above, ditch them all.
Oraclefusions
Junior member
- Messages
- 47
- Likes
- 3
I understand all you saying not using em indicators, fine, how am I gonna read the price action? Yes I have seen many times where a three white soldiers or three black crows behave exactly the oppiste and when a hammer in a perfect downtrend did not end the trend. However reading the price action through candle stick charts is all i can get my hads on in this charting software.
There was a method i saw where they talk about range bars where a bar is created only when a price moves within a certain spread, but then no one can predict the future, in which case trading is eventually a gamble game to a certain extent.
Anyway I have too little data, I can prvide more data, but you guys should tell me what and where to start from ? how to read the price action?
Cheers
M
malaguti
I understand all you saying not using em indicators, fine, how am I gonna read the price action? Yes I have seen many times where a three white soldiers or three black crows behave exactly the oppiste and when a hammer in a perfect downtrend did not end the trend. However reading the price action through candle stick charts is all i can get my hads on in this charting software.
There was a method i saw where they talk about range bars where a bar is created only when a price moves within a certain spread, but then no one can predict the future, in which case trading is eventually a gamble game to a certain extent.
Anyway I have too little data, I can prvide more data, but you guys should tell me what and where to start from ? how to read the price action?
Cheers
That is such a funny post.."how can I read price action without the indicators"
Indicators tell me nothing. Not a thing. Go right back to basics..answer me this. How do you define a trend? And dont tell me the ADX OK!
Oraclefusions
Junior member
- Messages
- 47
- Likes
- 3
I never said that I am relying on indicators to know "everything" except that these may compliment my decision to buy or sell.
Trend for me is a point from which the direction of price changes. For example if i look at the candle stick(sorry but I need to see candle stick as the privide me visial interpretation rather looking at price values. Hence a high tend starting point is where first candle that appears after the previous downtrend candle, such that its close price is above then the prev one, its higher price is also higher than the prev one and its low is lower(or shud i say extending higher downward in height) than the preceeding candle's low.
Apreciate if you can write a clear simple deinition.
That is such a funny post.."how can I read price action without the indicators"
Indicators tell me nothing. Not a thing. Go right back to basics..answer me this. How do you define a trend? And dont tell me the ADX OK!
Oraclefusions
Junior member
- Messages
- 47
- Likes
- 3
Looking at the same chart with only the prices and no other indicators.
I circled in the center, at 15 00 hrs where the circle covers three candle sticks which is the tuning point such that
a) preceeding 2 candle have higher lows and
b) following 2 candles also have higher lows
c) price rise - Now this condition is not true at all ,
You need to have two higher lows candles on each side to called a bullish trend , right?
Therefore can you please circle the areas in the chart where you think it fits the deinition of price change?
That is such a funny post.."how can I read price action without the indicators"
Indicators tell me nothing. Not a thing. Go right back to basics..answer me this. How do you define a trend? And dont tell me the ADX OK!
Shakone
Senior member
- Messages
- 2,460
- Likes
- 665
Oracle, I think in some ways you might be making things harder for yourself than they need to be.
When you started the thread, it seemed you were looking to hold on daily timeframe for a number of days to profit. From what you've said, this is a newly issued company, so there's only a couple of days to go on. Very hard to make any guesses about the long term behaviour of this, because there is no long term behaviour at all.
If a trade had to be made (and it doesn't, and I wouldn't), then based only on the info given, I would rather be looking at longs, and would look for a decent entry setup (based on support and context) the next day to get in. But I'd be ready to bail out on it within minutes, not days, if it went against me.
In terms of reading price action. This is a sticky area, as some believe there is no predictive value in what has happened in the past, only what is happening, while others believe there is, and either way, we often have different ideas about it.
In terms of looking at a bar, or 3 bars and making a conclusion about the future, I'll give an analogy. Suppose you are betting on the result of a football match, and trying to predict the result. If I showed you 5 minutes of a 90 minute football match, and you didn't know either team, what chance do you have of guessing the final result? Are those 5 minutes really enough to determine the next 85 mins? This to me is the equivalent of looking at a few individual bars on an instrument you don't know. You're unlikely to do much better than a coin flip. Perhaps if you knew the teams well (understood the instrument long term) AND were able to watch a fair bit more than 5 minutes AND had a good knowledge of football in general, you might just be able to do better than the coin flip.
There aren't that many things that can be learned from just one single trade. However, your initial trade, some possible lessons were, don't enter a trade if you don't have a clear plan and don't let a loss get out of control. You still don't have a plan, yet are considering entering on an instrument that was launched 2 days ago, without a clear entry or exit. So the lesson hasn't been learned. I realise this thread is partly for learning and discussion, but I just wanted to say that to make it clear that I don't think you should be trading anything at all until you've decided on a plan.
Oraclefusions
Junior member
- Messages
- 47
- Likes
- 3
I appreciate your post and I really read every bit of it. Most of what you said is clear for me. But if you noticed, I said in my earlier post that I have stopped trading for real and am now pratising on paper, hence my questions on here look trivial.
Every one has to start from some point a to reach to another pointy b. If i had a plan and every thing will be so clear, i will be on ther other side, meaning i will be like you advising others. I want to learn and reach to the strategy and a plan.
I am listening to all of what you are saying and i learned your valuable comments about how to relate trade for a new company.
ofcourse am not expecting to learn everything on here, i contacted a couple of people who offer coaching and its in the process, but trust me, openeing the first thread and today, I realized a lot and will need a whole lot more.
I hope you will not shut me up from askng questions and you can provide some roadmap or referecnes for me to read, which am sure you all started the same way. the very fist step.
Cheers
Oracle, I think in some ways you might be making things harder for yourself than they need to be.
When you started the thread, it seemed you were looking to hold on daily timeframe for a number of days to profit. From what you've said, this is a newly issued company, so there's only a couple of days to go on. Very hard to make any guesses about the long term behaviour of this, because there is no long term behaviour at all.
If a trade had to be made (and it doesn't, and I wouldn't), then based only on the info given, I would rather be looking at longs, and would look for a decent entry setup (based on support and context) the next day to get in. But I'd be ready to bail out on it within minutes, not days, if it went against me.
In terms of reading price action. This is a sticky area, as some believe there is no predictive value in what has happened in the past, only what is happening, while others believe there is, and either way, we often have different ideas about it.
In terms of looking at a bar, or 3 bars and making a conclusion about the future, I'll give an analogy. Suppose you are betting on the result of a football match, and trying to predict the result. If I showed you 5 minutes of a 90 minute football match, and you didn't know either team, what chance do you have of guessing the final result? Are those 5 minutes really enough to determine the next 85 mins? This to me is the equivalent of looking at a few individual bars on an instrument you don't know. You're unlikely to do much better than a coin flip. Perhaps if you knew the teams well (understood the instrument long term) AND were able to watch a fair bit more than 5 minutes AND had a good knowledge of football in general, you might just be able to do better than the coin flip.
There aren't that many things that can be learned from just one single trade. However, your initial trade, some possible lessons were, don't enter a trade if you don't have a clear plan and don't let a loss get out of control. You still don't have a plan, yet are considering entering on an instrument that was launched 2 days ago, without a clear entry or exit. So the lesson hasn't been learned. I realise this thread is partly for learning and discussion, but I just wanted to say that to make it clear that I don't think you should be trading anything at all until you've decided on a plan.
brewski1984
Senior member
- Messages
- 2,067
- Likes
- 355
Don't pay for any coaching, you can find it all somewhere on the internet for free providing you use some common sense about what you believe.
Oraclefusions
Junior member
- Messages
- 47
- Likes
- 3
I just found a useful article on price action here
How I Define the Trend | Articles-Technical-Analysis
How I Define the Trend | Articles-Technical-Analysis
Don't pay for any coaching, you can find it all somewhere on the internet for free providing you use some common sense about what you believe.
M
malaguti
I just found a useful article on price action here
How I Define the Trend | Articles-Technical-Analysis
Hi Oracle, what Shakone wrote is incredibly concise and what Brewski just commented on, is also correct. You are focusing on indicators, and you dont need them. We can say that quite easily, but we also learnt the hard way. We also (I'll speak for myself from here on in) I also started with indicators and looked for indicators to tell me what the trend was until I found out that the trend is easy to define and your link of yours is perfect.
Thats where you should start. Define the trend on every chart you do, start with the longer term picture, look at weekly bars for your long term trend, then look at daily bars for what the medium term trend looks like, and then finally look at perhaps hourly or 2 hourly to define what your shorter time frames are doing.
Learn when you are starting a new trend, and learn when it is over. when you can do that, and you can do that on each of these time frames...without indicators (unless its really necessary) you will have yourself the path that you want.
You DONT need to pay for that. you need to LEARN that.
THEN, when you are comfortable, how about learning to enter when the short term, is aligned with the medium term trend...thats what you are looking to do.
A trend is not 3 or 4 candles. Read your own link that you provided. It really is very very good. You enter when the shorter term time frame is ending, and rejoining the longer term time frame. Thats trend trading and thats what you need to start with.
Its not that easy, your link is great, but not so easy to do in practice. So go and practice it. PLease take Brewski's advice you dont need to pay for it. I paid, and then found it all in a book.
It was John J Murphy;s tachnical analysis of financial markets. Its a good book, but dont read it just yet. Start with the trend,
If you need help, please just let me know
wackypete2
Legendary member
- Messages
- 10,211
- Likes
- 2,058
brewski1984
Senior member
- Messages
- 2,067
- Likes
- 355
Nice action, saved him a small fortune👍
BeginnerJoe
Senior member
- Messages
- 3,329
- Likes
- 351
UPDATE:
Last price on the OP's stock is 86.50.
OP exited at 109 on the way down.
Peter
Interesting volume happening. Someone is loading up already.