It's the first week of the month in Extended Learning Track (XLT) class. This is always a good week because new traders get exposed to the lessons that will shape their trading strategy for years to come. While they don't know it yet, I know that what they learn in week one is the key ingredient for their success. Using price action alone, we cover exactly how to quantify demand (support) and supply (resistance), the "odds enhancers" that give us our objective probability score on each trading opportunity, and a set of rules for entry and exit during week one. The information we cover is applicable in any time frame which allows us to keep things very simple and rule-based.
I really don't use any indicators or oscillators myself and don't make them a major part of the Extended Learning Track (XLT) class, but for those who do, I have a trading page we look at in class each day that has Bollinger Bands and a moving average on it. We don't by any means abandon our strategy when we view this page for trade setups, we simply apply a similar set of rules to these market indicators. For your benefit, I will review two short-term Forex trades from the class this week using Bollinger Bands, a moving average, and demand and supply. Why use these tools?
Bollinger Bands: This is a standard deviation tool that when combined with demand and supply, can assist in letting me know when a market is momentarily too high or too low. Think of stretching the rubber band and you will understand Bollinger Bands.
Moving Average: A moving average is a tool we can use to help gauge the trend of average prices. This tells us what side of the market carries the greatest odds. In an uptrend, we want to be a buyer and buy from a novice seller who is selling after a decline in price, within an uptrend and the opposite when we sell short.
Demand and Supply: Recognizing where the most willing and able buyers and sellers are on a price chart is one of the most important pieces of information for the astute trader.
Combining these three tools allows us to objectively assess probability, risk, and reward for a trading opportunity. We could add more indicators and oscillators to this mix but why complicate things when we don't have to?
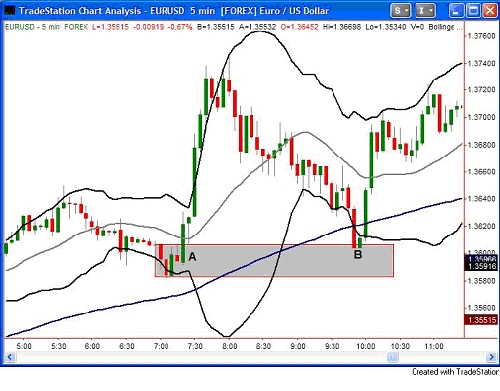
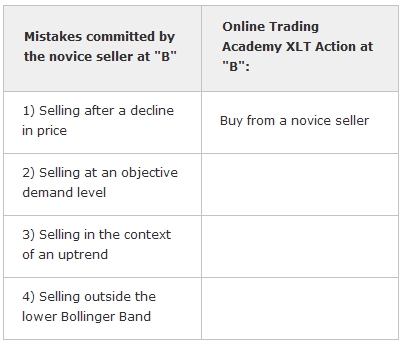
Above is a chart of the Euro/US Dollar. "A" represents a demand (support) level. This is because price rallied so strong from area "A". Price can only rally like that from "A" because there are so many more willing buyers than sellers at "A", demand exceeds supply. Next, notice the up-sloping blue line on the chart which is a simple moving average. It is sloping up meaning this market is in an uptrend in this time frame. At "B", price is now revisiting our objective demand level "A". This means that someone is selling AFTER a decline in price and AT a price level where demand exceeds supply. A seller making these two mistakes is going to lose much of the time according to the laws of supply and demand. But that's not all. They are committing more than those two mistakes. They are also selling in an uptrend; mistake number three. But that's not all. Another mistake they are committing is that they are selling as price pierces the lower Bollinger Band. A seller who is committing these four mistakes is taking the lowest probability action you can take in a market. By using tools to identify this novice action, we have just found a way to take the highest probability action in a market. In short, we want to buy from that novice seller at "B" which is into demand zone "A". The risk is low, the reward is high, and the probability of success is very strong.
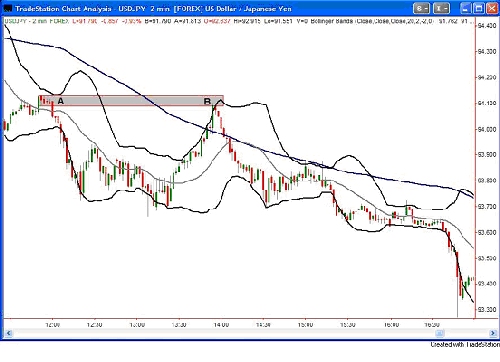
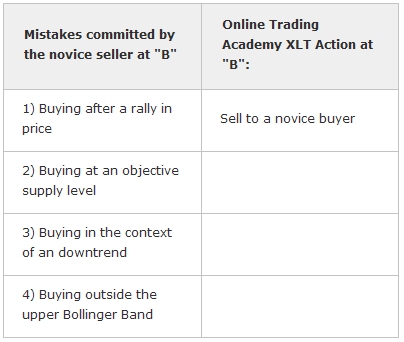
Here is a 2 minute chart of the US Dollar / Japanese Yen. "A" represents a supply (resistance) level. This is because price declined so strong from area "A". Price can only drop like that from "A" because there are so many more willing sellers than buyers at "A", supply exceeds demand. Next, notice the down-sloping blue line on the chart which is a simple moving average. It is sloping down meaning this market is in a downtrend in this time frame. At "B", price is now revisiting our objective supply level "A". This means that someone is buying AFTER a rally in price and AT a price level where supply exceeds demand. A buyer making these two mistakes is going to lose much of the time according to the laws of supply and demand. But again, that's not all. They are committing more than those two mistakes. They are also buying in a downtrend; mistake number three. Another mistake they are committing is that they are buying as price pierces the upper Bollinger Band. A buyer who is committing these four mistakes is taking the lowest probability action you can take in a market. By using tools to identify this novice action, we have just found a way to take the highest probability action in a market. In short, we want to sell to that novice buyer at "B" which is into supply zone "A". The risk is low, the reward is high, and the probability of success is very strong.
Sports are much the same way. In the NFL, all the teams know each other's playbooks. There is not a play a team can run that the other team is not aware of. What determines the outcome is which team can execute properly the longest without making mistakes. I have been playing ice hockey my whole life. I was playing in a hockey game Monday night. We have a good team and win most of our games. My friend and I have a play we run off of a face-off in our own zone where he takes the face-off and shoots the puck over to me and I take off and surprise the other team's defense as they are standing still at the drop of the puck and are not expecting me to come flying by them. We never use this play in the first period because we spend that period figuring out who the other team's weak defensemen are as we play. It is a hard play to run because my teammate has to take the perfect face-off and then I have to beat the other team's two defensemen myself, and then score on the goalie. Believe it or not, this works for us often. In my opinion, the success is attributed most to the fact that we only run this play when the other team's weakest defenseman is on the ice for that specific face-off in our own zone. Monday, in the third period, we had our chance. We had a face-off in our zone and I noticed that the weakest skater on the other team was standing on the blue line waiting for the puck to drop. I called my teammate's name and he knew exactly what to do. The puck dropped, I took off in full speed, caught the pass off the face-off, skated past the defense and went in on a break-away and scored. We were just doing what we do. It worked because we did it against a novice skater, exactly how we make money trading. The odds were stacked against that defenseman which means they were stacked in our favor.
By becoming an expert at identifying the novice trader, you become an expert in identifying the high probability trading opportunities. Turning this into a rule-based, simple strategy as we do in the Extended Learning Track (XLT) Futures and Forex classes is what leads to consistency. I hope this was helpful.
I really don't use any indicators or oscillators myself and don't make them a major part of the Extended Learning Track (XLT) class, but for those who do, I have a trading page we look at in class each day that has Bollinger Bands and a moving average on it. We don't by any means abandon our strategy when we view this page for trade setups, we simply apply a similar set of rules to these market indicators. For your benefit, I will review two short-term Forex trades from the class this week using Bollinger Bands, a moving average, and demand and supply. Why use these tools?
Bollinger Bands: This is a standard deviation tool that when combined with demand and supply, can assist in letting me know when a market is momentarily too high or too low. Think of stretching the rubber band and you will understand Bollinger Bands.
Moving Average: A moving average is a tool we can use to help gauge the trend of average prices. This tells us what side of the market carries the greatest odds. In an uptrend, we want to be a buyer and buy from a novice seller who is selling after a decline in price, within an uptrend and the opposite when we sell short.
Demand and Supply: Recognizing where the most willing and able buyers and sellers are on a price chart is one of the most important pieces of information for the astute trader.
Combining these three tools allows us to objectively assess probability, risk, and reward for a trading opportunity. We could add more indicators and oscillators to this mix but why complicate things when we don't have to?
Above is a chart of the Euro/US Dollar. "A" represents a demand (support) level. This is because price rallied so strong from area "A". Price can only rally like that from "A" because there are so many more willing buyers than sellers at "A", demand exceeds supply. Next, notice the up-sloping blue line on the chart which is a simple moving average. It is sloping up meaning this market is in an uptrend in this time frame. At "B", price is now revisiting our objective demand level "A". This means that someone is selling AFTER a decline in price and AT a price level where demand exceeds supply. A seller making these two mistakes is going to lose much of the time according to the laws of supply and demand. But that's not all. They are committing more than those two mistakes. They are also selling in an uptrend; mistake number three. But that's not all. Another mistake they are committing is that they are selling as price pierces the lower Bollinger Band. A seller who is committing these four mistakes is taking the lowest probability action you can take in a market. By using tools to identify this novice action, we have just found a way to take the highest probability action in a market. In short, we want to buy from that novice seller at "B" which is into demand zone "A". The risk is low, the reward is high, and the probability of success is very strong.
Here is a 2 minute chart of the US Dollar / Japanese Yen. "A" represents a supply (resistance) level. This is because price declined so strong from area "A". Price can only drop like that from "A" because there are so many more willing sellers than buyers at "A", supply exceeds demand. Next, notice the down-sloping blue line on the chart which is a simple moving average. It is sloping down meaning this market is in a downtrend in this time frame. At "B", price is now revisiting our objective supply level "A". This means that someone is buying AFTER a rally in price and AT a price level where supply exceeds demand. A buyer making these two mistakes is going to lose much of the time according to the laws of supply and demand. But again, that's not all. They are committing more than those two mistakes. They are also buying in a downtrend; mistake number three. Another mistake they are committing is that they are buying as price pierces the upper Bollinger Band. A buyer who is committing these four mistakes is taking the lowest probability action you can take in a market. By using tools to identify this novice action, we have just found a way to take the highest probability action in a market. In short, we want to sell to that novice buyer at "B" which is into supply zone "A". The risk is low, the reward is high, and the probability of success is very strong.
Sports are much the same way. In the NFL, all the teams know each other's playbooks. There is not a play a team can run that the other team is not aware of. What determines the outcome is which team can execute properly the longest without making mistakes. I have been playing ice hockey my whole life. I was playing in a hockey game Monday night. We have a good team and win most of our games. My friend and I have a play we run off of a face-off in our own zone where he takes the face-off and shoots the puck over to me and I take off and surprise the other team's defense as they are standing still at the drop of the puck and are not expecting me to come flying by them. We never use this play in the first period because we spend that period figuring out who the other team's weak defensemen are as we play. It is a hard play to run because my teammate has to take the perfect face-off and then I have to beat the other team's two defensemen myself, and then score on the goalie. Believe it or not, this works for us often. In my opinion, the success is attributed most to the fact that we only run this play when the other team's weakest defenseman is on the ice for that specific face-off in our own zone. Monday, in the third period, we had our chance. We had a face-off in our zone and I noticed that the weakest skater on the other team was standing on the blue line waiting for the puck to drop. I called my teammate's name and he knew exactly what to do. The puck dropped, I took off in full speed, caught the pass off the face-off, skated past the defense and went in on a break-away and scored. We were just doing what we do. It worked because we did it against a novice skater, exactly how we make money trading. The odds were stacked against that defenseman which means they were stacked in our favor.
By becoming an expert at identifying the novice trader, you become an expert in identifying the high probability trading opportunities. Turning this into a rule-based, simple strategy as we do in the Extended Learning Track (XLT) Futures and Forex classes is what leads to consistency. I hope this was helpful.
Last edited by a moderator: