firewalker99 said:
What are the things one would look for, when focusing on a chart (real time) tyring to identify a trend reversal? I know a break of the trendline isn't enough to qualify as a trend reversal. Can a further swing up (or down) in the direction other than the previous trend that reaches beyond (or below) the previous high (low) strengthen the thought of a trend reversal? Perhaps it's to early to ask these questions or perhaps I shouldn't be asking them at all and finding out for myself. But before one can identy a trend reversal, one must first learn to identify the trend (if I recall correctly one of the first steps Wyckoff advised).
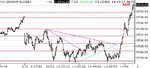
The trend is defined classically, higher highs and higher lows (in an uptrend). Trend change and trend reversal are also defined classically, the first a break of the TL and the second a drop below the last swing low (though price can sometimes rally back above that swing point and eventually resume the uptrend; therefore, the trader has to be alert to that possibility).
But as you're describing what you see on the chart in an objectively way, you are in fact already identifying things like "a slight retracement", "a trend reversal", "a supply line". Of course you've annotated the chart before, but perhaps it wouldn't be such a bad idea for me to do the same exercise without any lines, and in real time throughout a trading day?
The point of the thread was to show how S/R lines are drawn in contextual charts for prep and how new S/R lines are drawn in real time throughout the day as traders test and establish new ones. There is also the task of learning to read even hindsight charts from left to right, which is far easier to learn if charts are posted sequentially. Not drawing the lines at all would have made the task impossible for everyone who doesn't know how to do it already, and those who know how to do it already weren't the primary targets.
Most, of course, will look at the last chart in the sequence to see where S/R
was (this is suggested by the number of views of each chart). However, those who go through the sequence will see where S/R tentatively
is in real time and where it
might be later in the day. This is more useful to those who trade in real time, or want to, but not so much with those who are content to "trade" charts only in hindsight.
ADR is the 10-day average of the daily range. I find it to be a virtual lock in the NQ and use it for a target. Without it, trading the NQ would be far more difficult for me.
I'm not saying staring at charts is a complete waste of time, but personally, I don't have the feeling all these hours made me that much richer (I don't mean financially)....
Staring at price action and studying price action are two entirely different things. One doesn't learn anything about art simply by staring at it glassy-eyed, though he may come away with something like "Gee, that sure was purdy". Nor does one learn anything about charts by doing no more than staring at them, as I've said to you before. The trader must have some sort of focus or task or objective, such as how price behaves when it reverses. If he doesn't, the activity is useless.
As for "noise", I disagree with the idea of it, but it's not something I want to argue about, so I don't make an issue of it. But I don't find there to be any such thing as "noise". More often, the trader just doesn't know what he's hearing or what he's listening for.
Db