S/R and the Mirror of Erised

Analysis of charts #4, part 3

Left out with something of a range below 1538, the down trend is continued by heading for 1534, a level which previously had shown potential importance. When price is unable to go up beyond 1538 we can connect the LH's to what is in effect a trendline.
 

Attachments

  • FW4c.jpg
    FW4c.jpg
    46.2 KB · Views: 269
Last edited:
firewalker99 said:
As no one else has picked up the suggestion of analyzing, or narrating them the other charts, I've decided to give it a try regardless of the outcome or comments I may receive. I choose #4, because in #3 there were volume charts and as of yet I'm still looking at charts without the volume on it.

None of the price charts have volume plotted on them.
 
dbphoenix said:
None of the price charts have volume plotted on them.

I meant there were two volume only charts posted.
Another reason why I chose #4 is that there are less charts than on #3, taking it one step at a time.
 
Analysis of charts #4, part 4, 5 and 6

After the lower high, price hit 1354 and paused there a while. The red line indicates the breakthrough of support on a wide spread downbar. Price makes yet another lower high by just slightly touching the trendline, after which it's resuming it's decent.


1530 is an interesting level again, because we know this is where price previously was able to break through resistance. But nothing guarantees us that R will be S once again. What happens, is that a lot of trades are taking place around that zone, price is flirting with that level going below it slightly, then above again...


At the end of previous chart, price crossed the trendline, which could indicate a break of the trend although we would have to wait for confirmation of that. A sideways move is what follows. Around 11:45 buyers are able to move past the intraday short term resistance around 1531. They push price back to where it was about an hour ago (1534) for are only able to hold on for a short term. After that it's all down again as the wide spread bars could accumulate into a potential selling climax.
 

Attachments

  • FW4d.jpg
    FW4d.jpg
    46.6 KB · Views: 297
  • FW4e.jpg
    FW4e.jpg
    47 KB · Views: 246
  • FW4f.jpg
    FW4f.jpg
    47 KB · Views: 243
Last edited:
Analysis of charts #4 , part 7 and final part 8

At the lowest of the previous chart, at the cut-off, price was at 1524, which had been the take-off point for the upmove of the previous day. Indeed, buyers and sellers are acknowledging the price level and swerving around it. The downtrend which started the day, was interrupted by price recoiling for about 8 points. After that a new downtrend initiated as is visible by the second purple line. Price has no issues with going lower than 1524 and finally finds a soft landing at 1515.

The soft landing is accompanied further by a undecisive pattern of up and down moves between the ranges 1515-1520 and indicating a possible short term resistance to be found around 1519.

*Edit: note the horizontal line at 1524, drawn from left to right, which is the PDL.
 

Attachments

  • FW4g.jpg
    FW4g.jpg
    39.6 KB · Views: 274
  • FW4h.jpg
    FW4h.jpg
    39.9 KB · Views: 269
Last edited:
Charts from posting #3

I had been working on an analysis of the charts from post #3, when I was disheartened to see that firewalker had already posted an analysis. On closer inspection, it seem he has analyzed the charts from #4, so it all worked out for the best.

7/11/2006

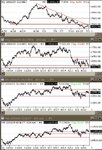
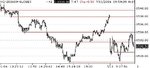
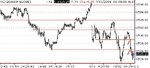
Context (first chart): Comparing this "context panel" of charts with the panel from the previous day, it's clear that the NQ not only does not have the same buffer as the ES and YM between the current price and lows formed in mid-October, but the previous day has accentuated this difference. The NQ begins the day barely above support formed by these lows and tested in early June. In contrast, ES and YM, which also saw prices fall the previous day, have held above congestion areas which formed in mid-June -- obviously not the case with NQ.

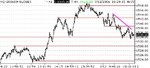
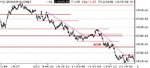
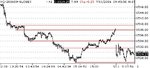
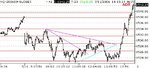
Some trading days seem to begin with a question that needs answering. In the case of the NQ, the daily chart highlights that price is at the extreme lower right corner formed by (a) the supply line descending from the high of 6/30 and (b) the strong support level (1526, approximately) prominent on the longer term chart. Today's question appears to be whether prices will break down through this support level or break up through the two-week-old supply line. It's decision day.

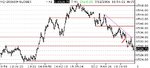
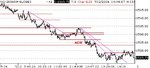
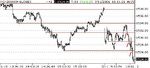
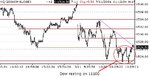
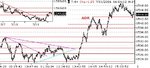
Previous Day (second chart): As the market opens, price is between the PDL (about 1526, marked as a S/R level) and the PDC (1534, which is also marked, and comprised support during the early afternoon of the previous day). Also marked as key S/R levels are 1540, the support level visible on the daily chart through which price penetrated the previous day, and 1538, which was the overnight high (and which also formed the lower boundary of the congestion zone just below 1540).

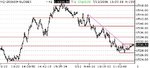
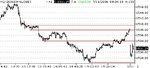
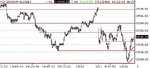
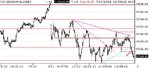
Opening (third chart): The opening is volatile (compare bar lengths with those from the previous afternoon), but that's normal. Generally, price remains within the confines of the S/R levels at 1532 and 1526. The first bar plunges from 1532 to just over 1528, where price consolidated just before and after making the daily low the previous day.

After stalling at +/- 1528, price then tests the opening bar's high, is forced briefly down to just above the level where it had just stalled (1529), then consolidates for several bars between 1531 and 1532. When no further upward progress can be made at this level, sellers gain the upper hand and push price down nearly to the PDL. But take a look at the bar lengths just preceding this low: price inches down with each bar, barely making any progress, like a spring being loaded (it would be particularly interesting to see the volume that accompanied these bars to get some sense of the support offered as price approached the low).

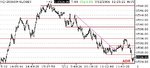
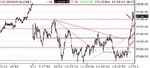
Then, suddenly, the spring is released, and price shoots up to around 1531.5 where sellers decisively turn back the advance. Why here? We see that, the previous day, this level acted as support then resistance as price moved down to the PDL, and resistance then support on the way back up. This level's importance is confirmed today as price finds sufficent selling pressure here to be turned back again (this is the justification for drawing in the new S/R line), to 1529, where it again finds support.

The result of the opening price action has been to delineate some S/R levels but, at this point, price is pretty much centered between those levels, and no sustained directional movement has been achieved.
 

Attachments

  • SR1a.jpg
    SR1a.jpg
    103.8 KB · Views: 296
  • SR1b.jpg
    SR1b.jpg
    38.7 KB · Views: 270
  • SR1c.jpg
    SR1c.jpg
    39.6 KB · Views: 267
As it happens, price descends no further than 1529 (for now). This is a HSL, the significance of which would seem to be demonstrated by the move through resistance at 1531.75 and above the opening high (to about 1533.75, and that seems ample justification for drawing in the new S/R line). After bouncing briefly off the 1532 S/R line, however, price retreats back down to 1530.50, either raising or answering the question (depending on your point of view) of whether the movement upward can be sustained.
 

Attachments

  • SR2.jpg
    SR2.jpg
    36.4 KB · Views: 266
For the moment, any question about upward movement is decided here, as price falls through support at 1529, bounces off the PDL (followed by a test of support-turned-resistance at 1529, which helps confirm its importance), and then breaks down through the PDL at 1526.25 on a wide-bodied bar. (The wide-bodied bar is evidence of the energy required to break through the PDL, and would by itself indicate that something has just happened that is worth paying attention to). Sellers are out in force as price heads as low as 1523.
 

Attachments

  • SR3.jpg
    SR3.jpg
    37.4 KB · Views: 251
Since this is a tick chart, a selling climax can appear differently than it would on, say, a 5-minute chart. I would guess that on a 5-minute candle chart, most if not all of the price movement below 1526 would be represented by a candle shadow. In any case, after hitting a low around 1523, price moves quickly and decisively back through the S/R line at 1526.25 and, with barely a pause, exceeds and then briefly tests the 1529 S/R level. Price is now just about at the middle of first bar of the pre-opening, BUT from a technical standpoint, a great deal has been accomplished. Namely, the PDL and the long-term support level it was sitting on have been strongly tested and have held. Price has also surged back up through two S/R levels that might have been expected to provide some resistance with no apparent difficulty. All of this would seem to invite at least a test of the upside.
 

Attachments

  • SR4.jpg
    SR4.jpg
    38.3 KB · Views: 268
But selling is far from exhausted at this point. Far from testing the daily highs, price plunges downward -- again through our S/R levels, with only the slightest hesitation evident at each level -- before consolidating just below the PDL between 1524 and 1526. This arc from 1523 to 1531 and back to 1524 forms a LSH which, if price broke significantly below the current daily low, would help define a downward trend.
 

Attachments

  • SR5.jpg
    SR5.jpg
    41.1 KB · Views: 276
Just in case you guys are waiting for me, why not comment on each others' work? Sort of a We Are The World thing.

Db
 
After a quick test of resistance at 1526.25, price makes two more runs at the 1523 low, achieving only slight (and relatively insignificant) progress each time. The first retest of the previous low again rebounds up to test the 1526.25 level. The second retest breaks through 1526.25, to perhaps 1527 but runs into sufficient selling pressure to turn back down. This allows the drawing of a supply line from the (+/-) 1534 daily high.
 

Attachments

  • SR6.jpg
    SR6.jpg
    44.9 KB · Views: 315
dbphoenix said:
Just in case you guys are waiting for me, why not comment on each others' work? Sort of a We Are The World thing.

Sorry for the long break between posts. I was unavoidably interrupted. I'd be happy to go through and comment on fw's posts and would welcome his comments as well.
 
Price just will not be contained below the 1526.25 resistance level, though initially it is turned back nearly 3 points from 1527 to 1524.25. The next run up doesn't get quite as far, but the recoil is less from this one (1526.75 to 1525), and then price is up and through the resistance level (and the supply line), going so far as to penetrate resistance at 1529 for two bars before falling back below the 1529 resistance level.

If, like me, you would have drawn a tentative demand line from the 11:00 low to those recoils -- at 1524.25 and 1525 -- from resistance mentioned in the last paragraph, then by 12:00, that demand line would run along a HSL (at 1524.25) and the recoil to 1525. After the resistance at 1526.25 is surpassed, a HSH (at 1530.50) is formed, and we would seem to be making some progress towards establishing a pattern of HSH's and HSL's.

However, that demand line would have been broken by this latest price movement down from 1530.50 to 1525.50, especially the spike down just after 12:00. By this time, a trader looking to enter in either direction might be searching for some recognizable guideposts. If we adjust our broken demand line to the blue demand line drawn on the chart, and draw in a new supply line after price again tests resistance at 1529, we can see a wedge forming. We can draw in upper and lower boundaries to the latest swings within the wedge (dotted red lines), and enter once price exceeds one of those levels. That would be one way to regain our bearings.

And in short order, price breaks out of our wedge formation, down through support at 1526.25 and down through the dotted red line at 1525.50 -- all the way to 1524.
 

Attachments

  • SR7.jpg
    SR7.jpg
    44.5 KB · Views: 299
Once again (around 1:00) support at 1523 is tested, but buying pressure again is sufficient to repel the decline. Then, for about an hour, price enters a congestion zone between appr. 1523.50 and 1525.75. There's tension here, plenty of it. We've broken down out of a wedge, but price has again -- for the fourth time -- been unable to break through support. Price is literally sitting right on top of a critical technical level. As price ricochets off the top and bottom of this congestion zone, the pressure is building. Finally, price explodes upward out of the congestion zone, through resistance levels at 1526.25, 1529, 1531.75 and in short order through the DH (at appr. 1534) to 1536, where it retraces to support at the just violated daily high.
 

Attachments

  • SR8.jpg
    SR8.jpg
    46.7 KB · Views: 290
Last edited:
Support at 1534 does not hold for long, and price falls back to just above the 1532 support level before turning back up and continuing its advance to the ADR at 1542.25.
 

Attachments

  • SR9.jpg
    SR9.jpg
    47.2 KB · Views: 243
Price again retraces, now to a support level from the previous day at 1538, but the movement back up doesn't make it as far, and price forms a lower high at 1542 before falling back through support to just above the OH level of 1534. The LSH formed at 3:00 is a technical reversal of the upward trend, but 1534 is never breached, and price soon breaks back above 1538 and continues upward as high as 1548 before retracing at the close to the ADR at 1542.25.

The technical question posed at the beginning of the day has been answered. The long term support level stretching back to the previous October has been tested and has held. The supply line stretching down from the high in late June has decisively been broken.
 

Attachments

  • SR10.jpg
    SR10.jpg
    53.8 KB · Views: 299
FX_Cowboy said:
I'd be happy to go through and comment on fw's posts and would welcome his comments as well.

Same goes for me. I'll try and get into it tomorrow.
 
Last edited:
dbphoenix said:
Price then resumes its decline, reaching 1526. Here it rallies back to 1528 where it consolidates long enough to "break" the supply line. It then rallies further to S/R, then through, then to the top of the congestion at 1530. A slight retracement, then a further rally toward S/R at 1534, and while there's no clear "swing point", clearing that congestion level might qualify as a trend reversal.

What are the things one would look for, when focusing on a chart (real time) tyring to identify a trend reversal? I know a break of the trendline isn't enough to qualify as a trend reversal. Can a further swing up (or down) in the direction other than the previous trend that reaches beyond (or below) the previous high (low) strengthen the thought of a trend reversal? Perhaps it's to early to ask these questions or perhaps I shouldn't be asking them at all and finding out for myself. But before one can identy a trend reversal, one must first learn to identify the trend (if I recall correctly one of the first steps Wyckoff advised).

But as you're describing what you see on the chart in an objectively way, you are in fact already identifying things like "a slight retracement", "a trend reversal", "a supply line". Of course you've annotated the chart before, but perhaps it wouldn't be such a bad idea for me to do the same exercise without any lines, and in real time throughout a trading day?
 
dbphoenix said:
Price now resumes its descent, pausing at 1540, then continuing on to the ADR at 1538. Given the new low, a new TL can be drawn, but there's really no point in doing so. Down is down.

You annotated ADR on the chart. As I can only acknowledge the fact it's on the chart, but have no real knowledge of how to apply it I didn't mention it in my analysis. I am curious on the other hand whether ADR is something you devised yourself by backtesting your setup or just something you use to identify possible tranding ranges. Like on this chart, does ADR mean the average of the last 10 days, 3 months, 1 year,...?
 
Top