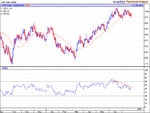
i am a newbie to trading, amongst other things i have learn't that the S&P 500 is the most important index in the world, whilst experimenting with my charts i've come across attachment of S&P 500 which shows it has topped with the RSI making lower lows.
Is this start of a new downtrend, as it's only breached the 30MA intra-day not end-of-day until now. It seems thay every stab of the 30MA brings in the buyers, until now. RSI also shows support at 50 but now been breached with lower lows.
Is it worth shorting for the short term??
I would appreciate any comments to help me with direction of this index.
thanks
sonny
Attachments
Last edited: