Real time and historic charts

kevin546

Established member
Messages
699
Likes
0
Can anyone point me in the right direction.

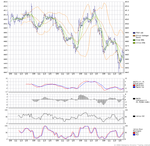
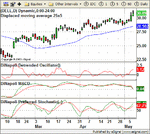
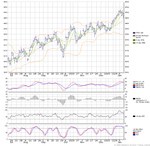
I would like to find a charting package that provides both real time and historic charting but, my particular preference is that it is possible to set 3 or 4 lower indicators beneath the price chart without the price chart losing all shape or becoming to small. At the same time I am looking for the lower indicators to be small in size but still have good clarity.

As yet I have been unable to find anything like the attached chart which does meet my criteria but unfortunately does not provide streaming real time charts. Although I should add I would want the lower indicators to continue week on week unlike this chart which lost data due to the close over the New Year. LOL
 

Attachments

  • ftse ample 800 x 600.png
    ftse ample 800 x 600.png
    23.5 KB · Views: 734
This is what the Historic one would look like
 

Attachments

  • ftse ample 6 mth small.png
    ftse ample 6 mth small.png
    23.6 KB · Views: 724
Ideally while I like the size of the lower indicators on these charts it would be beneficial to have the facility to increase the height of the price charts or that they provide pre set higher price charts (but without large lower indicators) and width for something longer term. This one has been increased in width but the height could do with being taller. I have tried Sierra charts which are very good value for money but even 2 lower indicators had an effect on the price chart.
 

Attachments

  • ftse ample 1 yr large.png
    ftse ample 1 yr large.png
    27.3 KB · Views: 720
Tradestation does this but it is not cheap. How far back do you
want to go as this will affect what options are possible. I would
also think that esignal would offer this possibility as well.


Paul
 
Paul

Thanks for the reply, the important part would be the real time intraday being able to view 20 days trading on the single screen using anything from 15 to 60 min charts.

As for longer term 6 months to a year on a daily time frame would be fine.

As for the historic enough to conduct reasonable assessment for long term trend analysis.

While I know Esignal are good would the price chart be effected by the selection of 4 lower indicators.

Kevin

Ps : Maybe if someone has access to such charts they would be kind enough to post one so it could be compared etc.
 
Having had a quick look at the esignalUK site it would appear from a selection displayed you can select 4 lower indicators but it reduces the size of the price chart and the lower indicators do not have the same sharpness as those I have already posted.
Maybe it has something to do with the real time effect.
 
Kevin,

I would think that you can scale the size of each section on
esignal, I know that you definitely can with Tradestation.


Paul
 
Depending on the markets u want to trade have a look at Updata's Technical Analyst - for UK and NASDAQ stocks it is excellent but not for worldwide futures.

It must be said it does not have the flexibility of tradestation
 
Rog

Thanks and will do.

Paul

Here are a couple of samples from esignal one no use the other a bit of promise. From the info taken from the site they do have a pop out window facility so a chart can be increased to screen size. It would appear when selecting 2 or more lower indicators it takes up half the chart size. Do not know if these are full screen shots or not but the lower indicators from the standard intraday set-up looks ok although the bands have made a mess of the upper chart, hopefully it is not a full screen shot and would improve. In the advanced set-up 0not sure if it is included in basic) they have the facility to place more than 1 study in a slot. That could save me space when selecting both Macd and Macd Histogram as they can be overlaid.
 

Attachments

  • advchart3.gif
    advchart3.gif
    21.9 KB · Views: 535
That one clearly does not meet my requirements, this is a bit better
 

Attachments

  • dinapoli.gif
    dinapoli.gif
    15.2 KB · Views: 530
Still not as sharp as the Ample one's but better than the last.
This one has promise.
 

Attachments

  • intraday.gif
    intraday.gif
    21.7 KB · Views: 511
Really depends what it looks like full screen this last one has something new to me, the ability to view a lower indicator over a section of the chart. I wonder if you can select other studies alongside it so that only 1 study is directly under the current price action. While I would prefer all indicators to sit directly under the price chart the others could be viewed for confirmation and not necessary to be under the price. It maybe a way round the problem. This one comes from the standard package.
 

Attachments

  • historicalchart2.gif
    historicalchart2.gif
    11.3 KB · Views: 556
QuoteTracker can handle that:
http://www.quotetracker.com/

QT intraday charts let you have as many top or bottom indicators as you want. QT does adjust the size of the price chart when you add bottom indicators, BUT you can then adjust how much space is taken by bottom indicators by just dragging the horizontal separator. Also, QT now lets you overlay multiple bottom indicators which can save you space.

The intraday charts are max 5 days if you are registered. QT can show up to 20 days of intraday data on historical charts.
 
Kevin,

I would also have recommended Quotetracker but thought you
had a requirement for more than 5 days of intra-day data. What
you cannot tell from the screenshots you have taken is if you can
scale the vertical size of each of the lower indicators. If you can
then your problem is over as all you do is adjust the vertical size
of each indicator as well as the chart and then save it and you
are sorted.


Paul
 
Jerry

Thanks for the info I will have a look although I do require up to 15 days on the 60 min chart. I may have this wrong and got quotetracker mixed up with another company but I thought these were rather unreliable.

Paul

I take your point, I had this facility with Sierra charts but you could only really use 2 lower indicators and the price chart started to become compressed. May give the free trial a go and see how it works out.
 
kevin, the live intraday charts are max 5 days. The historical charts can be set to an intraday time period from 1 to 20 days. Not sure what you mean by "rather unreliable". They work just fine.
 
Just to add something a contact directed me to this

http://www.dailyfx.com/FinanceChart.html

They offer free real time charting of the Forex with a number of indicators.

Jerry

I used Quotetracker just over 2 years ago and found them unreliable, would lose service to frequently. Maybe things have improved. I think this was the service where you selected a data provider and they created the charts from this data. I had 2 different sources for real time prices in the UK and each time I lost connection the sites were still running ok so the problem appeared to be at quotetracker end. Maybe I was wrong but I took the opinion what could I expect from doing it on the cheap.
 
Paul

Regarding the esignal charts I posted I am told they can be re-sized as you suggest and they do provide an automatic extending trendline which I found a great tool when using Sierra charts. Obviously esignal can do a alot more than I require but from the charts I posted they appear to be in 2 distinct style's. The first are not very sharp yet that 15 min chart with the black background the lower indicators are just right. I am also told they no longer have FTSE cash values so if I go down that path would need the LIFFE exchange and they always sting you compared to the US prices.

Still got to have a look at Updata but esignal do appear to have a good track record.
 
kevin546 said:
Paul

I am also told they no longer have FTSE cash values so if I go down that path would need the LIFFE exchange and they always sting you compared to the US prices.

Hi Kevin546,

To clarify, we still carry FTSE Index Values and have no plans to discontinue carrying them. Here's a link to all the exchanges we cover and their associated fees.

In terms of the charts posted earlier in this thread, I think you'd find eSignal very customizable for your purposes. You can alter the fonts and colors and adjust the various windows and panes in a myriad of ways. Might want to just take our risk-free 30 day trial and see for yourself.

Thanks.
 
esignal

I mentioned the values following the information I was given by one of your customers but I did note you still had it displayed on your exchange prices.

I probably will go for your trial but will wait for the optimum time with work etc. I had taken the view when comparing the charts particulary the 15 min one that it may have something to do with settings. You will be getting a call from me in the future.

Kevin
 
Top