trade with high leverage in comparison to the stocks making up the
indexes. Buying 100 shares of the SPY
(the ETF that tracks the S&P 500 index) would cost nearly $29,200 at the
time of this writing. Even with 2:1
margin, a trader would need $14,600 to maintain the position. To trade one contract of the ES (the S&P
500 eMini future), a trader only needs $6930.
For an intraday trade, the margin could be as low as $500!
The
first half hour to hour of the equity markets can be very volatile. Sometimes
it seems like prices are fluctuating wildly with no rhyme or reason. However,
there is a technique that could help you predict the morning price movement and
even potential price reversals. This technique could be used for finding highly
successful intraday trade opportunities.
Take
note that the price of the futures is not the same as the index. This is done
on purpose. Buying index futures can be done to participate in the broad market
without having to buy all of the stocks individually. Since a trader can put down smaller margin
and trade futures in lieu of stocks, they could theoretically earn interest on
the money that they are not using had they bought the stock. The futures
exchanges attach a fair value to the future’s pricing in order to make them
priced similarly to the equivalent index.
A futures trader will not receive dividends as would the stock or ETF
trader. That dividend value must be
subtracted from the interest added to arrive at the fair value.
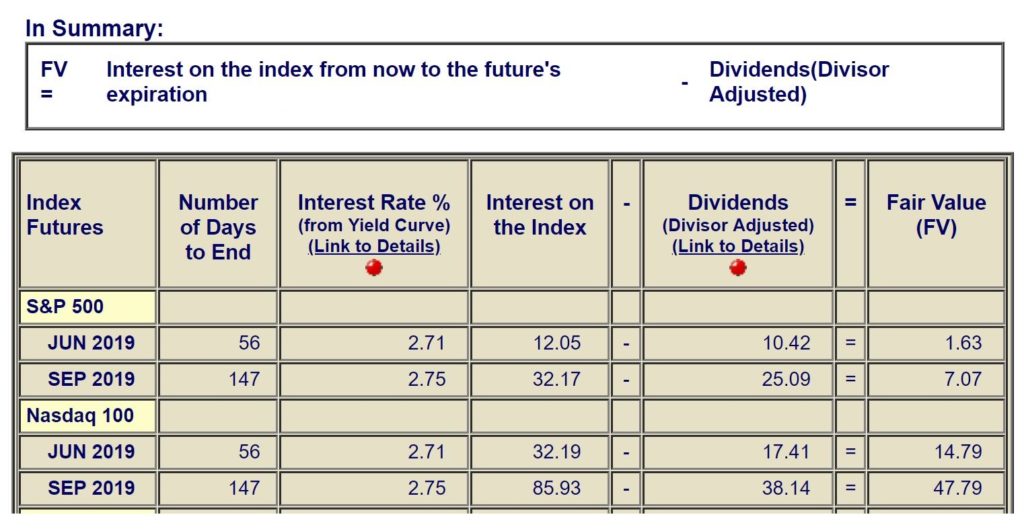
Futures
Fair Value = Interest available on the future contract until expiration minus
the dividends to be paid on the stocks until the expiration.
The fair value only changes once a day when the equity market closes. That is when a stock would go ex-div and pay out a dividend and also when there is one less day of interest until expiration. There are plenty of sites that show you the fair value number. I tend to check www.indexarb.com to get the data.
Due
to the market forces of supply and demand and price movement, the relationship
between the index futures and the indexes themselves will change. While there is a fair value assigned to the
futures, they may not be trading at that value from time to time.
There
are a group of institutional traders called program traders who have their
computers set to recognize mispricing between the S&P 500 Index and the
S&P 500 Futures. When the mispricing
occurs, they buy the undervalued security (or the stocks making up the index)
and sell the overvalued one. This is
known as an arbitrage opportunity.
As
you can see from the fair value, the S&P Futures should be trading 1.63
points below the S&P 500 Index for the entire day. The buy and sell thresholds tell the program
traders when the two are mispriced and ready for an arbitrage opportunity.
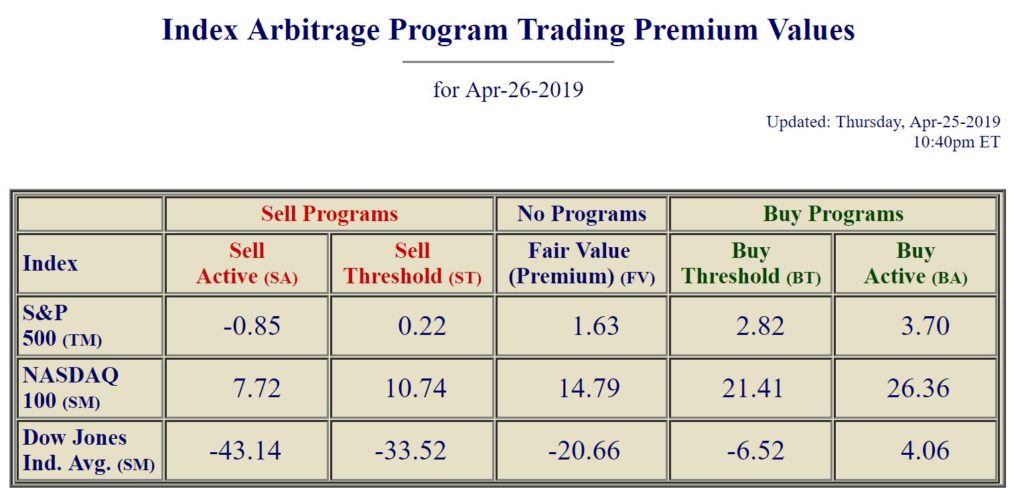
Looking
at the picture above, we can see the buy and sell thresholds with the fair
values. Should the difference between the S&P 500 futures and the S&P
500 index become greater than 2.82, some of the program traders will buy the
undervalued stocks in the S&P 500 and sell the S&P futures to bring the
two back in line. If a larger move on the futures pushes the price above what
the index is trading at by more than 3.70, then all the programs traders should
act and a sharp movement in the markets would result.
The
opposite would occur should the difference between the S&P index and the
futures become too great on the downside.
If the price gap between the two becomes smaller than 0.22, then some
program traders will buy the futures and sell most of the stocks making up the
S&P 500 index. If the price of the
futures drops more than 0.85 below the price of the index, then all the program
traders should move in and buy futures and short the stocks. This will result in a larger move in both the
index and the futures.
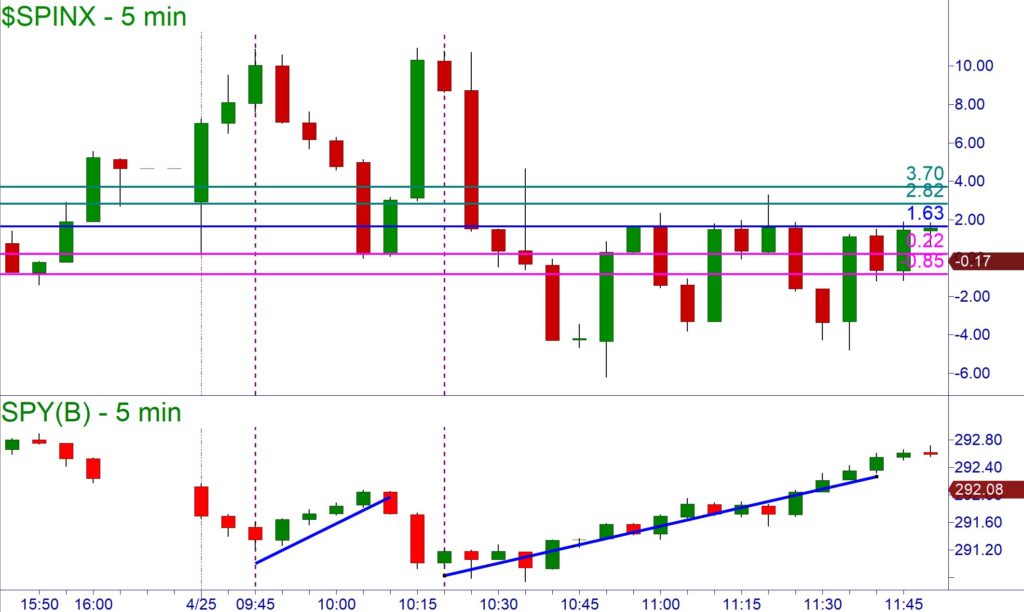
In
TradeStation, you can chart the price difference between the S&P 500 index
and the S&P 500 futures. This is
called the premium and the symbol is $SPINX.
If we look at the following chart of the premium along with the program
trading buy and sell thresholds drawn on the chart, we can identify the times
when these programs will move the markets.

You
can see that within the first hour of the market opening, the premium spiked
too high two times. Since the premium was too high the program traders acted
and caused a rally in the equity market until the premium was near the 1.63
target. This gave a knowledgeable trader
an excellent buying opportunity on SPY or even the individual stocks that
follow the market.
On
any given day, when you are watching your stock or the SPY approaching a supply
zone and are trying to decide whether you should sell or short the level, look
at what the premium is doing. If it is
approaching the lower levels or sell thresholds, then you should have more
confidence that the level will hold. If
you are looking at a demand zone on your stock and the premium is moving up to
or beyond the buy threshold, you should have a higher confidence of the demand
zone working.
I
decided to take it one step further and placed a Bollinger Band set to 20
periods and an exponential moving average on the premium chart. I noticed that when the band was pierced, it
often corresponded with an immediate change of trend direction in the SPY ETF.
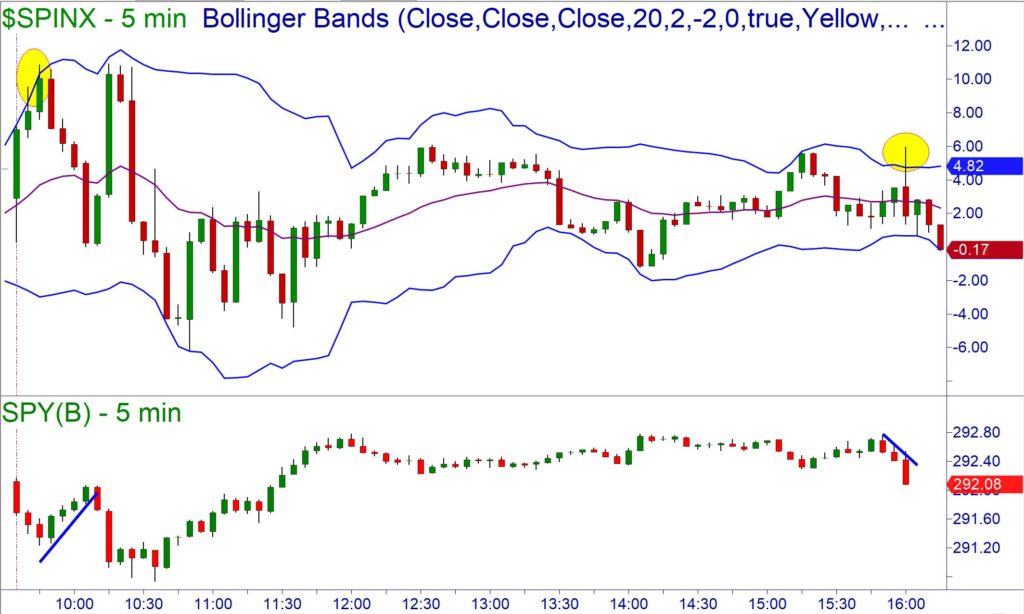
We must not forget that we need to make our trading decisions on Core Strategy of supply, demand, and trend. So, while the premium chart with Bollinger Bands is not the holy grail of technical analysis, it is something that a trader can use as a decision support tool.
Brandon Wendell can be contacted on
this link: Brandon Wendell