Mike Kshemaraja
Established member
- Messages
- 852
- Likes
- 63
Thanks for the feedback, especially about the big round number. As I reread Bob's book and assemble some notes I keep picking up information that I overlooked on my first read (like avoiding BRN areas except when prices are trending nicely). I'll need to continue trading light, which one can do with Forex, but it certainly helps to do some trading. But for now I need a bit more in the "quality of my education" department.
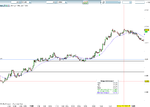
The market should be able to be traded with this method on all time/tick scales. Bob did the work finding the appropriate ema for the 70 tick chart, and looks like Alexander Elders factor of five leads to the same choice of the 20 ema on the 350 tick chart as well. I haven't done a careful side by side comparison but the 350 tick looks similar to the 5 minute chart that Al Brooks uses. Just a quick look at the two charts and you can see that the tick chart hides the information you do not want (endless low volume bars that go nowhere) and shows information that you want (buyer/seller volume coming in on spikes).
Later,
Chart
Chart
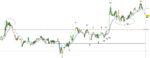
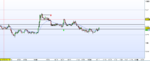
I also think you got in a middle of a fighting cat (1.31), you need to constantly remember that as a retailer you do not have the luxury to get into the fight, wait and enter only once one of the part lets go of the rope, that is our edge.
You need to have a clear mind to do that and that is why is better not to trade if the chances are not there. Yes, many times we will miss trades, but also means that we are building stronger patience.
Also I did not see any reasons to why you have to scratch the trade, the technical side of it was indicating otherwise. (Fear)
As you can see from the chart there could have be other possibility to enter once the bulls took control.
Screen time will make the difference (backed by passion and tenacity), I suggest the you stick to only one timeframe, so you can became very familiar with it, what works after the fact in a different environment is just an illusion.
Mike
Attachments
Last edited: