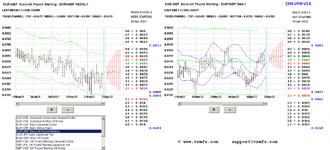
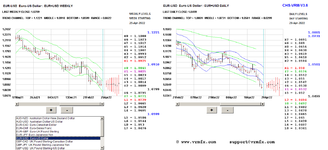
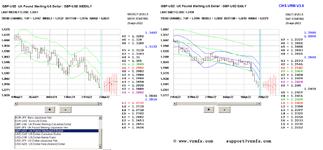
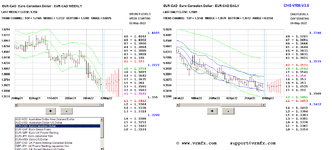
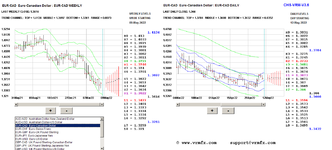
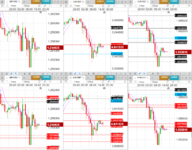
Commentary for price action of GBP-USD, EUR-GBP and EUR-USD about their respective VRM levels on 27 April 2022.
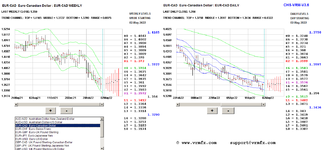
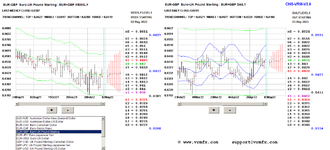
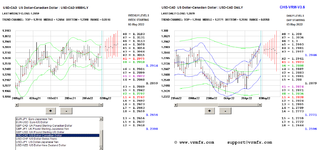
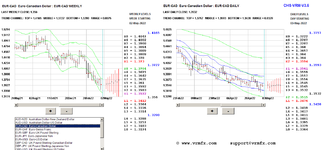
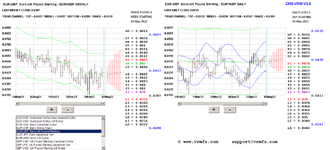
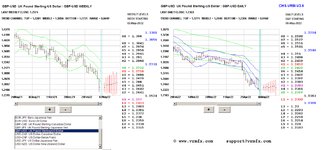
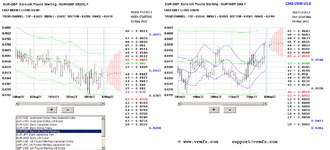
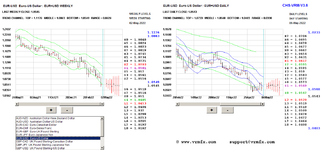
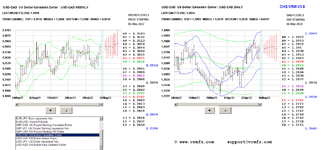
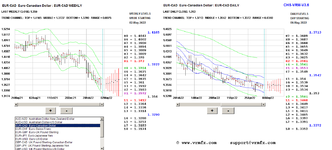
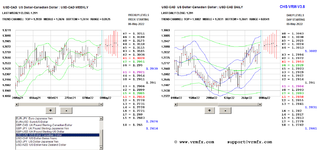
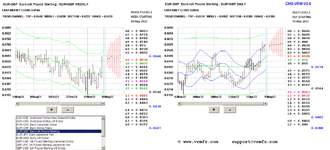
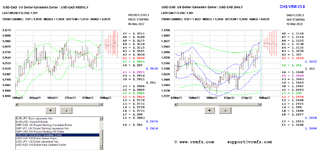
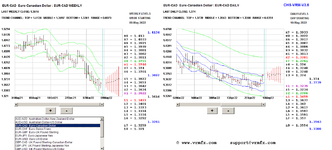
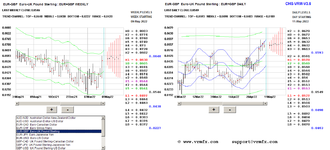
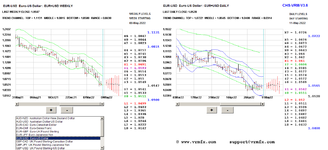
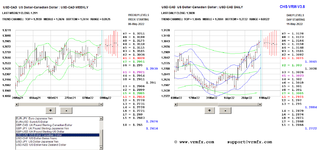
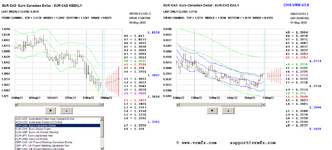
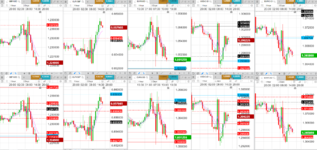
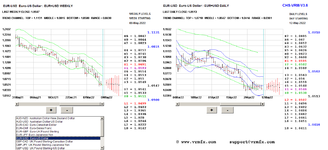
Price action shown in attached charts together with VRM predicted levels.
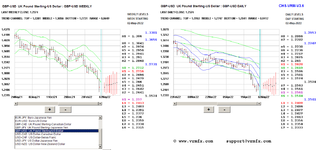
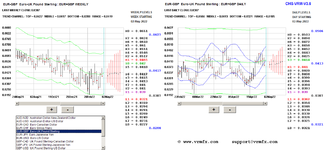
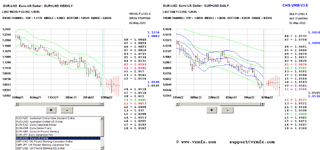
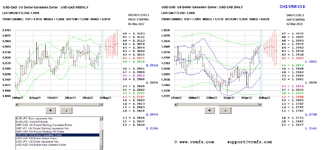
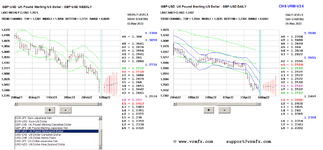
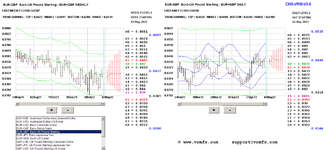
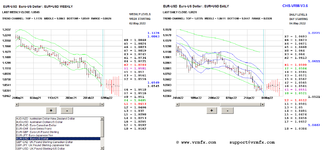
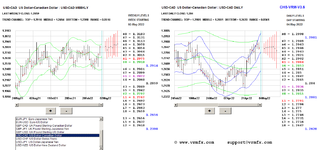
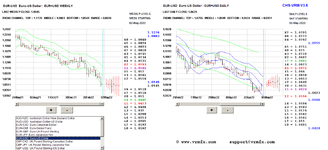
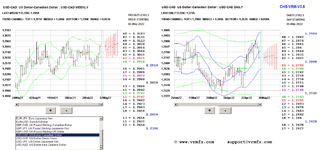
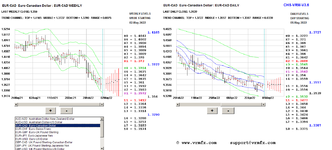
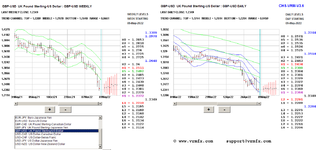
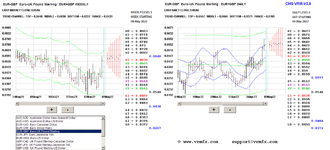
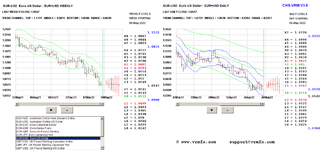
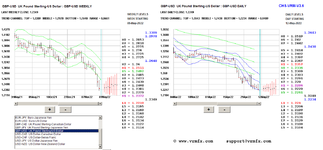
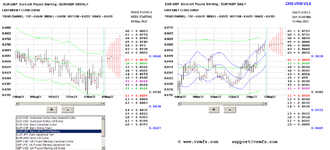
In these charts H and L levels are solid lines, sentiment levels are dashed lines. Top, middle and bottom of trend channels are coloured blue.
Markets opened 18:00 in the attached charts. Weekly VRM levels in the top charts. Daily VRM levels in the bottom charts
==============================================================
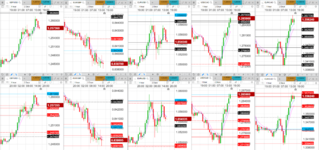
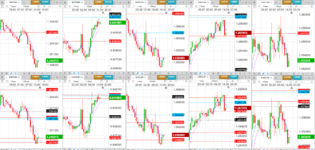
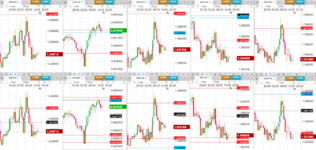
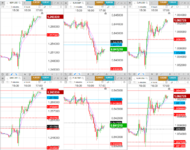
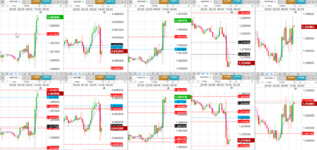
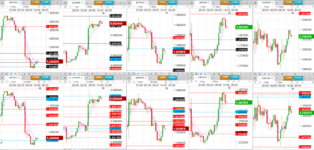
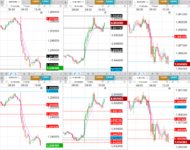
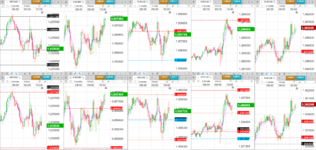
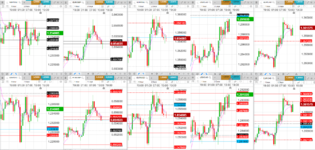
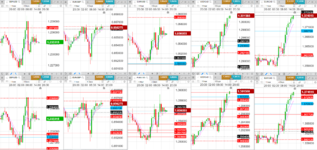
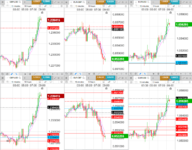
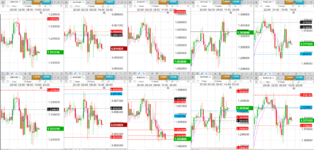
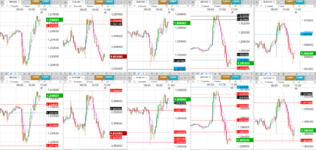
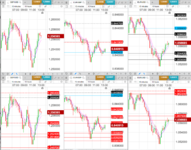
Two results charts attached. First with 1 hour candlesticks for the 24 hours. Second chart shows the interaction of the FX pairs with the VRM levels using 15 minute candlesticks. You can see which FX pair is leading, following or onlooking.
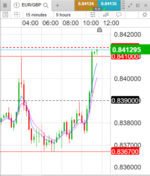
EUR-GBP started the session with support on the top of its short term trend channel at 0.8452. It then fell through in the 03:00 hour. A good sell opportunity then occurred in the 05:00 hour.
EUR-USD tried to break up through the bottom of its short term trend channel at 1.0657. It failed in the 02:00 hour with a spinning top candlestick.
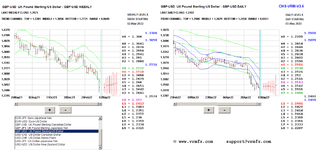
Today was a sell EURO day with GBP-USD reacting when it could. GBP-USD was trapped between its highest and lowest daily sentiments of 1.2604 and 1.2545 before finally falling with EUR-USD.
============================================================
See post #1057 on page 53 for a description of the VRM and a PDF describing the VRM charts attached.
G
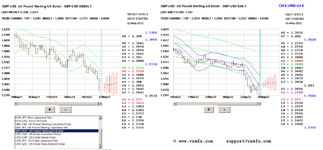
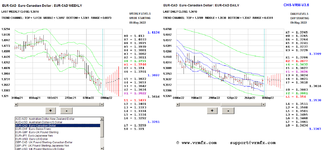
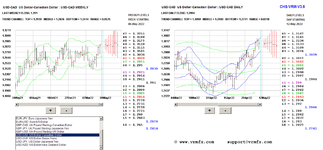
Price action shown in attached charts together with VRM predicted levels.
In these charts H and L levels are solid lines, sentiment levels are dashed lines. Top, middle and bottom of trend channels are coloured blue.
Markets opened 18:00 in the attached charts. Weekly VRM levels in the top charts. Daily VRM levels in the bottom charts
==============================================================
Two results charts attached. First with 1 hour candlesticks for the 24 hours. Second chart shows the interaction of the FX pairs with the VRM levels using 15 minute candlesticks. You can see which FX pair is leading, following or onlooking.
EUR-GBP started the session with support on the top of its short term trend channel at 0.8452. It then fell through in the 03:00 hour. A good sell opportunity then occurred in the 05:00 hour.
EUR-USD tried to break up through the bottom of its short term trend channel at 1.0657. It failed in the 02:00 hour with a spinning top candlestick.
Today was a sell EURO day with GBP-USD reacting when it could. GBP-USD was trapped between its highest and lowest daily sentiments of 1.2604 and 1.2545 before finally falling with EUR-USD.
============================================================
See post #1057 on page 53 for a description of the VRM and a PDF describing the VRM charts attached.
G
Attachments
Last edited: