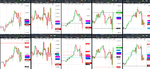
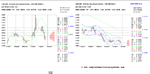
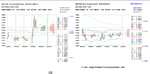
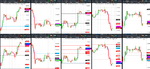
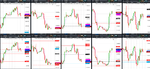
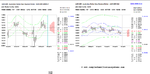
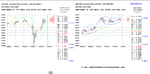
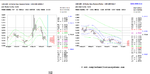
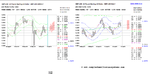
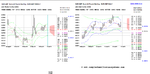
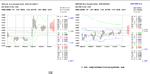
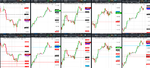
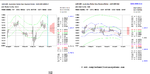
GBPUSD, EURGBP, EURUSD, USDCAD & EURCAD ---- PREDICTIONS PROVIDED IN YESTERDAY'S POST 9:54 PM T2W LOCAL TIME
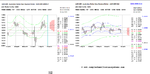
GBPUSD, EURGBP, EURUSD, USDCAD & EURCAD results for 2nd July 2020
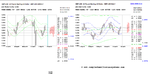
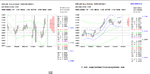
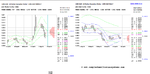
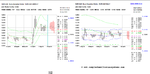
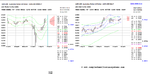
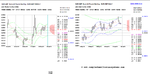
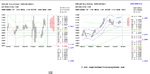
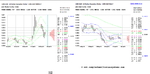
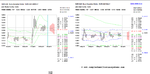
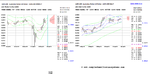
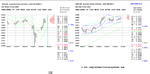
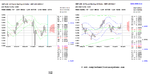
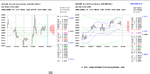
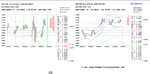
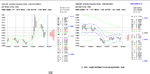
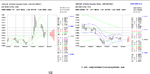
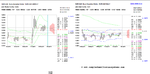
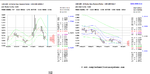
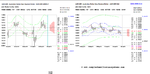
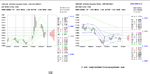
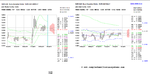
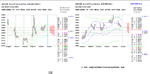
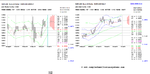
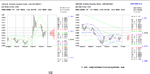
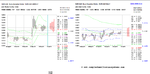
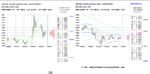
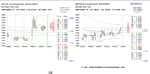
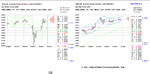
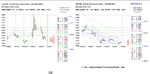
Volatility Response Model (VRM) described in the first post of this thread.
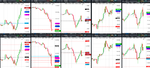
EURCAD added to complete another triplet. Now there are two triplets.
EURGBP X GBPUSD = EURUSD
EURUSD X USDCAD = EURCAD
The FX pairs follow each other about their respective VRM levels. Good for additional trading signals !
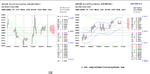
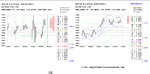
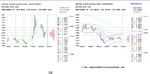
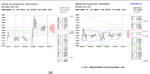
The daily VRM charts below now only display the highest , lowest and S1 sentiments levels. These are the most important sentiment levels.
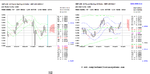
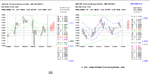
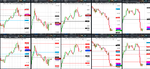
2 FILES ATTACHED - ALL LEVELS IN THE ATTACHED CHARTS WERE ON LAST POST
TWO FILES
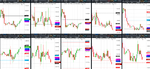
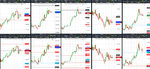
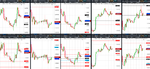
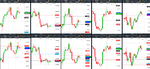
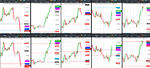
Show consecutive charts covering the full 24 hours
Weekly VRM levels in the top 30 minute charts. Daily VRM levels in the bottom 30 minute charts . Daily VRM levels only valid for the last 24 hours. Times are GMT-3. EMA channel (4,7) included. All charts show the mid-price between the bid and the offer.
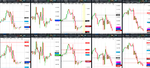
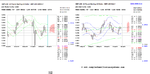
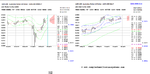
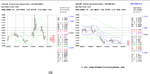
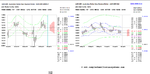
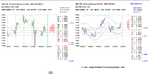
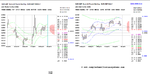
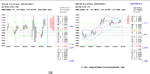
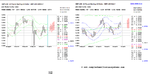
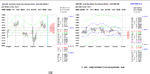
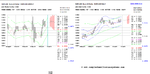
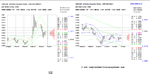
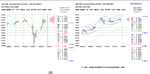
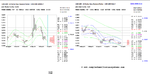
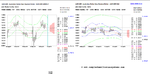
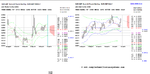
GBPUSD, EURGBP, EURUSD, USDCAD & EURCAD results for 2nd July 2020
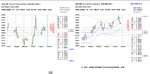
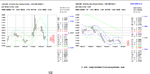
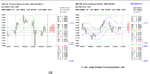
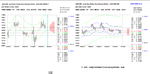
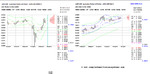
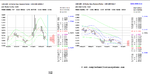
Volatility Response Model (VRM) described in the first post of this thread.
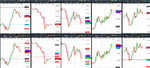
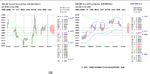
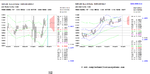
EURCAD added to complete another triplet. Now there are two triplets.
EURGBP X GBPUSD = EURUSD
EURUSD X USDCAD = EURCAD
The FX pairs follow each other about their respective VRM levels. Good for additional trading signals !
The daily VRM charts below now only display the highest , lowest and S1 sentiments levels. These are the most important sentiment levels.
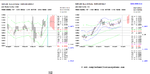
2 FILES ATTACHED - ALL LEVELS IN THE ATTACHED CHARTS WERE ON LAST POST
TWO FILES
Show consecutive charts covering the full 24 hours
Weekly VRM levels in the top 30 minute charts. Daily VRM levels in the bottom 30 minute charts . Daily VRM levels only valid for the last 24 hours. Times are GMT-3. EMA channel (4,7) included. All charts show the mid-price between the bid and the offer.