Commentary on the price action of GBP-USD, EUR-GBP, EUR-USD and USD-CAD about their respective VRM levels on 26 May 2022.
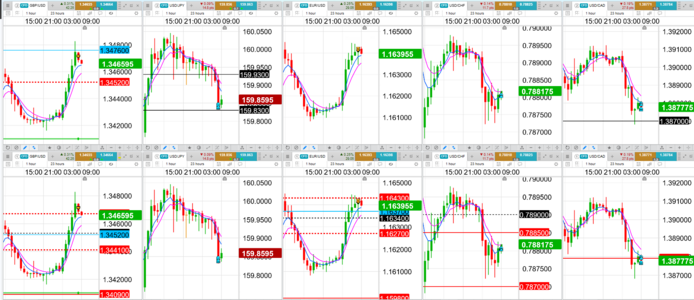
Price action shown in attached charts together with VRM predicted levels.
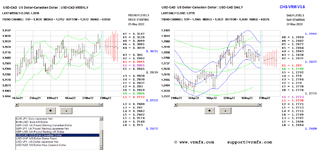
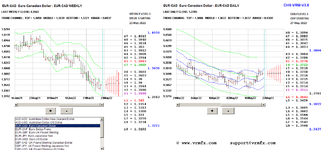
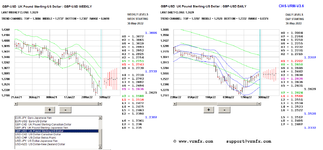
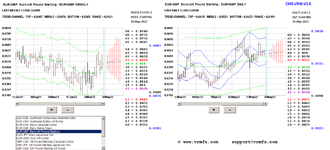
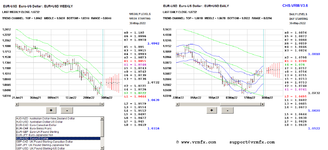
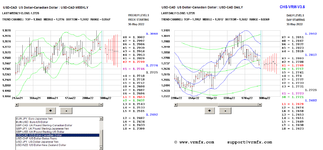
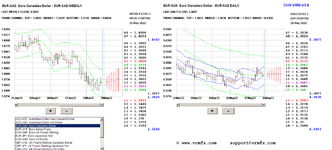
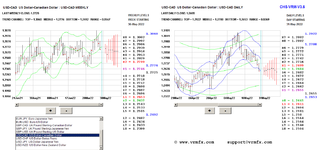
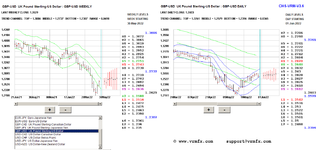
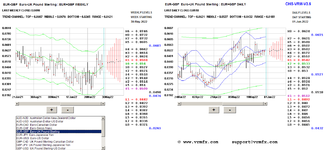
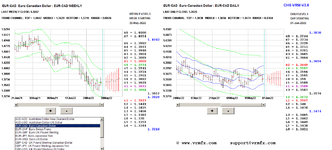
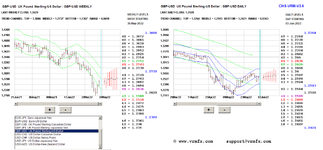
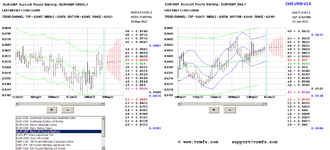
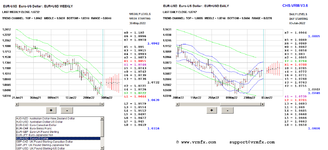
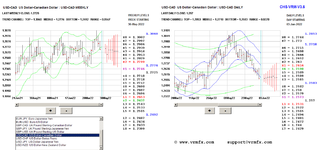
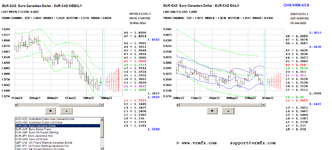
In these charts H and L levels are solid lines, sentiment levels are dashed lines. Top, middle and bottom of trend channels are coloured blue.
Markets opened 18:00 in the attached charts.
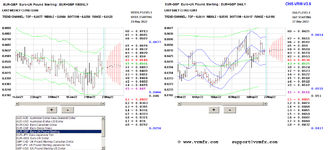
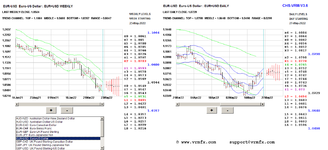
Weekly VRM levels in the top charts. Daily VRM levels in the bottom charts
==============================================================
MAJOR NEWS
09:30 USD GDP (QoQ) (Q1)
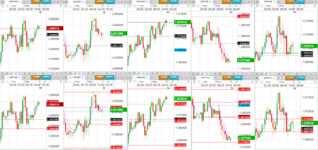
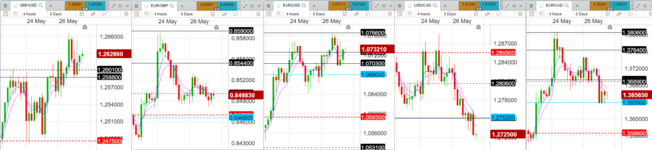
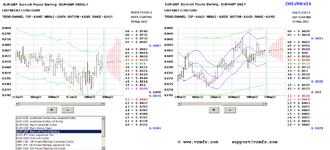
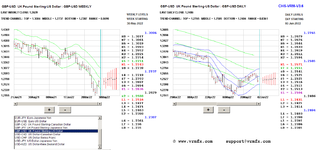
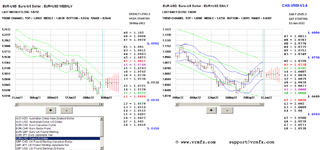
GBP-USD stayed trapped between its highest and lowest daily sentiment levels so had no direction. On GBP-USD's first fall from its highest daily sentiment level 1.2606 EUR-GBP started to rse and then made its daily high at its H level 0.8528.
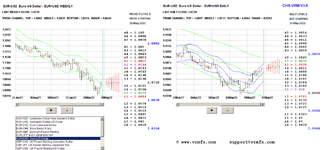
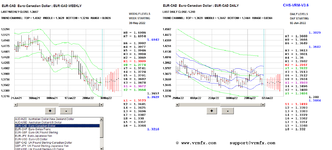
EUR-USD spent the day following. As GBP-USD fell from its daily sentiemnt level 1.2606 EUR-USD followed. As GBP-USD found support and rallied from its lowest daily sentiment level 1.2554 EUR-USD also rallied.
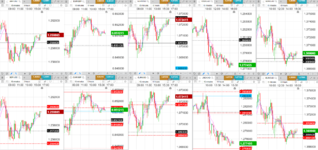
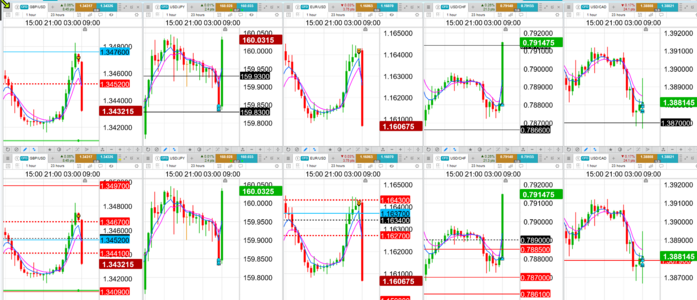
Not much reaction on the US GDP news.
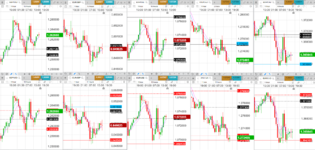
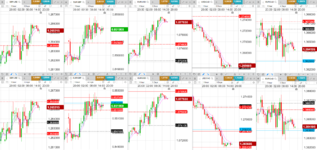
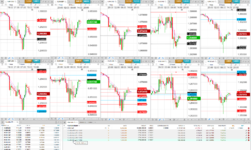
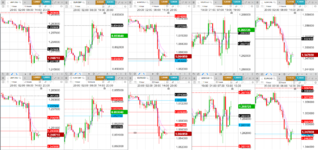
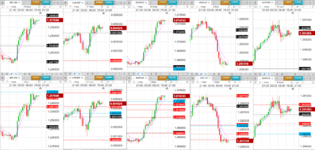
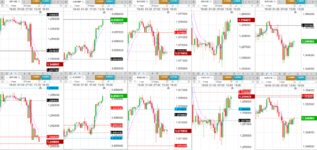
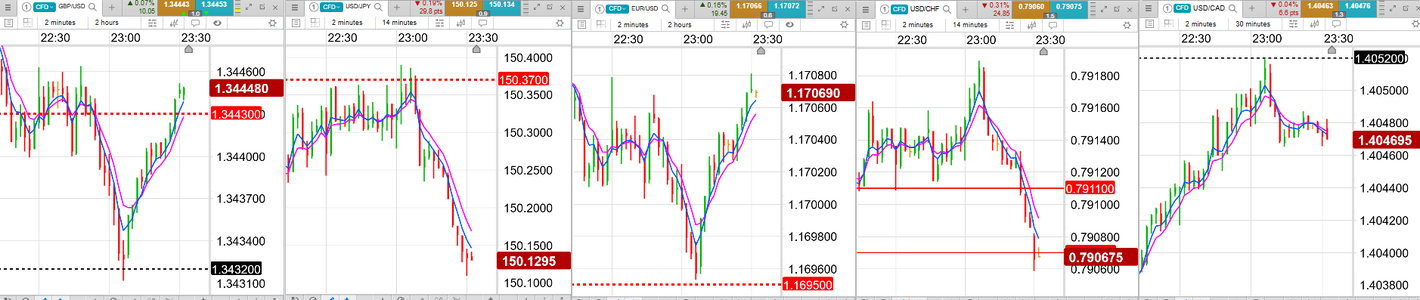
15 minute chart attached about the time of the US GDP news.
ATTACHED
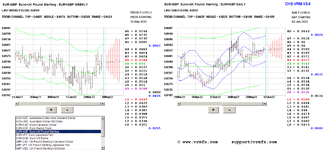
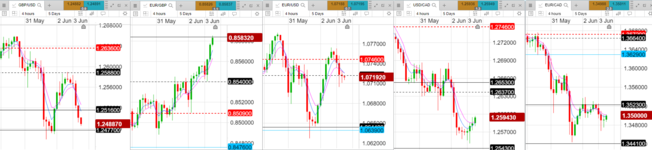
1 hour charts for day
15 minute charts about 09:30 US GDP news
============================================================
For a description of the VRM and a PDF describing the VRM charts attached see this link...
G
Price action shown in attached charts together with VRM predicted levels.
In these charts H and L levels are solid lines, sentiment levels are dashed lines. Top, middle and bottom of trend channels are coloured blue.
Markets opened 18:00 in the attached charts.
Weekly VRM levels in the top charts. Daily VRM levels in the bottom charts
==============================================================
MAJOR NEWS
09:30 USD GDP (QoQ) (Q1)
GBP-USD stayed trapped between its highest and lowest daily sentiment levels so had no direction. On GBP-USD's first fall from its highest daily sentiment level 1.2606 EUR-GBP started to rse and then made its daily high at its H level 0.8528.
EUR-USD spent the day following. As GBP-USD fell from its daily sentiemnt level 1.2606 EUR-USD followed. As GBP-USD found support and rallied from its lowest daily sentiment level 1.2554 EUR-USD also rallied.
Not much reaction on the US GDP news.
15 minute chart attached about the time of the US GDP news.
ATTACHED
1 hour charts for day
15 minute charts about 09:30 US GDP news
============================================================
For a description of the VRM and a PDF describing the VRM charts attached see this link...
Predicting future FX support and resistance levels using mathematics
I attach the VRM predictions for tomorrow for 16th July for GBPUSD, EURGBP, EURUSD, USDCAD & EURCAD. Coloured levels are the important VRM levels. Watch out for the top, middle and bottom of the short term trend channel (blue) colliding with the top, middle or bottom of the long term trend...
www.trade2win.com
G