Predicting future FX support and resistance levels using mathematics

GBPUSD, EURGBP, EURUSD & USDCAD results for 20th March 2019 - Fed Interest Rate Decision

Volatility Response Model (VRM) described in the first post of this thread.

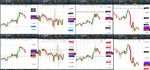
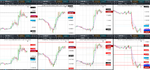
Here are the results for the GBPUSD, EURGBP, EURUSD & USDCAD at end of day 20th March - Fed Interest Rate Decision

The VRM charts below now only display the highest , lowest and S1 sentiments levels. These are the most important sentiment levels.

Weekly VRM levels in the top 1 hour charts. Daily VRM levels in the bottom 1 hour charts. Times are GMT-4 . EMA channel (4,7) included.

Prior to the Fed Rate Decision ........

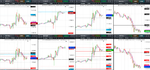
GBPUSD fell finding support at daily level 1.3219. Rose back to its lowest daily sentiment level 1.3244 before falling to its low for the day.

Meanwhile EURGBP rose to its weekly level 0.8637 followed by GBPUSD to its low for the day.

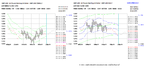
USDCAD spent at least 15 hours trying to break through the middle of its short term trend channel at 1.3337 before starting its fall.

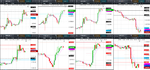
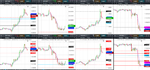
Just prior and on the Fed Interest Rate Decision...

USDCAD started to sell off the hour before

EURUSD found support on its long term trend channel middle at 1.1351

The markets knew what the decision would be. It was sell USD time.

Lots of good trades today.

2019-03-20-GBPUSD-EURGBP-EURUSD-USDCAD-1hr-1hr.png
 
GBPUSD, EURGBP, EURUSD & USDCAD results for 22nd March 2019 - German Manufacturing PMI

Volatility Response Model (VRM) described in the first post of this thread.

Here are the results for the GBPUSD, EURGBP, EURUSD & USDCAD at end of day 22nd March - German Manufacturing PMI

The VRM charts below now only display the highest , lowest and S1 sentiments levels. These are the most important sentiment levels.

Weekly VRM levels in the top 10 minute charts. Daily VRM levels in the bottom 10 minute charts. Times are GMT-4 . EMA channel (4,7) included.

Prior to the German Manufacturing PMI at 5:30 (GMT-4)

EURUSD unable to break through its highest weekly sentiment level at 1.1396 and fell below its daily S1 sentiment level 1.1379

GBPUSD fell below its highest daily sentiment level at 1.3139

EURGBP was already bearish as it could not break through its lowest daily sentiment level 0.8669

Three signals all indicating sell GBPUSD, EURGBP and EURUSD

On the German Manufacturing PMI at 5:30 (GMT-4) GBPUSD, EURGBP and EURUSD all fell

GBPUSD found support at its daily S1 sentiment level 1.3088

EURUSD found support for at least 5 hours at its daily level 1.1298

GBPUSD then rallied to the middle of its short term trend channel at 1.3215

EURGBP fell to its low for the day at its weekly S1 sentiment level 0.8547

==============================================================

Lots of good trades with the VRM levels today

2019-03-22-GBPUSD-EURGBP-EURUSD-USDCAD-10min-10min-1325.png
 
GBPUSD, EURGBP, EURUSD & USDCAD results for 29th March 2019 - UK Brexit vote - UK GDP - CA GDP

Volatility Response Model (VRM) described in the first post of this thread.

Here are the results for the GBPUSD, EURGBP, EURUSD & USDCAD at end of day 29th March - UK Brexit vote - UK GDP - CA GDP

The VRM charts below now only display the highest , lowest and S1 sentiments levels. These are the most important sentiment levels.

TWO CHARTS

FIRST CHART

Weekly VRM levels in the top 1 hour charts. Daily VRM levels in the bottom 1 hour charts. Times are GMT-4 . EMA channel (4,7) included.

GBPUSD moved between daily high level 1.3107 and bottom of short term trend channel 1.2997

EURGBP moved synchronously with GBPUSD between daily levels 0.8644 and 0.8567

EURUSD stayed trapped between the highest daily sentiment level 1.1236 and the lowest daily sentiment level 1.1212

USDCAD fell bellow its daily S1 sentiment level 1.3430 prior to the GDP announcement then fell to its daily level 1.3345

SECOND CHART

Weekly VRM levels in the top 10 minute charts. Daily VRM levels in the bottom 10 minute charts. Times are GMT-4 . EMA channel (4,7) included.

Show the 10 minute charts during the main movements of the day

2019-03-29-GBPUSD-EURGBP-EURUSD-USDCAD-1hr-1hr.png

2019-03-29-GBPUSD-EURGBP-EURUSD-USDCAD-10min-10min-1424.png
 
GBPUSD, EURGBP, EURUSD & USDCAD results for 5th April 2019 - US Non farm payrolls

Volatility Response Model (VRM) described in the first post of this thread.

Here are the results for the GBPUSD, EURGBP, EURUSD & USDCAD at end of day 5th April - US Non farm payrolls

The VRM charts below now only display the highest , lowest and S1 sentiments levels. These are the most important sentiment levels.

THREE CHARTS

FIRST CHART

Weekly VRM levels in the top 1 hour charts. Daily VRM levels in the bottom 1 hour charts. Times are GMT-4 . EMA channel (4,7) included.

In chronological order:

20:00 pm 4th April EURGBP finds resistance at its daily S1 sentiment level 0.8584 and falls. GBPUSD follows and rises.

2:00 am 5th April GBPUSD finds resistance at its highest daily sentiment level 1.3109 and falls. EURGBP follows and rises

GBPUSD falls to its low for the day at daily level 1.2992. EURGBP rises to its high for the day at its daily level 0.8635

Meanwhile EURUSD had some volatility at the announcement of the NFP and rises to its high for the day at its highest daily sentiment level 1.1250 then slumps to its low for the day at its lowest daily sentiment level 1.1211

Meanwhile USDCAD found support at its daily S1 sentiment level 1.3353 and rose to its high for the day at its daily level 1.3401

LAST TWO CHARTS

Weekly VRM levels in the top 10 minute charts. Daily VRM levels in the bottom 10 minute charts. Times are GMT-4 . EMA channel (4,7) included.

Show the 10 minute charts during the main movements of the day

2019-04-05-GBPUSD-EURGBP-EURUSD-USDCAD-1hr-1hr.png

2019-04-05-GBPUSD-EURGBP-EURUSD-USDCAD-10min-10min-1416.png

2019-04-05-GBPUSD-EURGBP-EURUSD-USDCAD-10min-10min-1743.png
 
GBPUSD, EURGBP, EURUSD & USDCAD results for 12th April 2019

Volatility Response Model (VRM) described in the first post of this thread.


Here are the results for the GBPUSD, EURGBP, EURUSD & USDCAD at end of day 12th April

The VRM charts below now only display the highest , lowest and S1 sentiments levels. These are the most important sentiment levels.

ONE FILE ATTACHED

Weekly VRM levels in the top 1 hour charts. Daily VRM levels in the bottom 1 hour charts. Times are GMT-4 . EMA channel (4,7) included.

GBPUSD started the 24 hour period with support on its weekly S1 sentiment level 1.3056. Finally rallying to its high at daily level 1.3121

EURGBP started with support at its lowest daily sentiment level 0.8616 and rallied to its high at the middle of its long term trend channel at 0.8643

EURUSD started the 24 hours with support at the middle of its short term trend channel at 1.1256 and rallied to its highest daily sentiment level 1.1317

USDCAD started the 24 hours with resistance at its daily S1 sentiment level 1.3378 and fell to its daily level 1.3309

An easy day's trading with the VRM.

2019-04-12-GBPUSD-EURGBP-EURUSD-USDCAD-1hr-1hr.png
 
GBPUSD, EURGBP, EURUSD & USDCAD results for 23rd April 2019

Volatility Response Model (VRM) described in the first post of this thread.


Here are the results for the GBPUSD, EURGBP, EURUSD & USDCAD at end of day 23rd April

The VRM charts below now only display the highest , lowest and S1 sentiments levels. These are the most important sentiment levels.

TWO FILES ATTACHED

FIRST FILE

Weekly VRM levels in the top 1 hour charts (showing the last 2 days) . Daily VRM levels in the bottom 1 hour charts. Times are GMT-3 . EMA channel (4,7) included.

GBPUSD flat-lined yesterday and today rose to its high at its weekly S1 sentiment level 1.3023

GBPUSD followed EURUSD to its high for the day at weekly S1 sentiment level 1.1261. (EURUSD also tested this level yesterday)

GBPUSD and EURUSD fell from their respective highs at the same time.

GBPUSD fell to its low at weekly level 1.2938 and got trapped between its two weekly levels 1.2938 and 1.2944

EURUSD made its low for the day in the same hour 11:00 (GMT-3) as GBPUSD made its low.

EURGBP made its low at its weekly sentiment level 0.8636 and rallied as GBPUSD fell.

USDCAD made its daily low early on at its daily S1 sentiment level at 1.3344 and made its high at its daily level 1.3441

SECOND FILE

Weekly VRM levels in the top 10 minute charts. Daily VRM levels in the bottom 10 minute charts. Times are GMT-3 . EMA channel (4,7) included.

Show the 10 minute charts during the main movements of the day

2019-04-23-GBPUSD-EURGBP-EURUSD-USDCAD-1hr-1hr.png

2019-04-23-GBPUSD-EURGBP-EURUSD-USDCAD-10min-10min-1556.png
 
GBPUSD, EURGBP, EURUSD & USDCAD results for 26th April 2019

Volatility Response Model (VRM) described in the first post of this thread.


Here are the results for the GBPUSD, EURGBP, EURUSD & USDCAD at end of day 26th April

The VRM charts below now only display the highest , lowest and S1 sentiments levels. These are the most important sentiment levels.

TWO FILES ATTACHED

FIRST FILE

Weekly VRM levels in the top 1 hour charts. Daily VRM levels in the bottom 1 hour charts. Times are GMT-3 . EMA channel (4,7) included.

GBPUSD rallied from the bottom of its long term trend channel at 1.2889 back to its weekly level 1.2944

EURGBP looked on as it oscillated between its weekly levels 0.8636 and 0.8623

EURUSD rallied from its lowest daily sentiment level at 1.1125 up to its highest daily sentiment level 1.1164

USDCAD fell from its weekly high level 1.3498 to its lowest daily sentiment level 1.3449.

SECOND FILE

This is the chart of VRM predictions for GBPUSD seen by users at the start of yesterday's 24 hours. The format of this chart is described in the first post of this thread. As can be seen GBPUSD has been long term and short term bearish since the close on the 4th April. On and after this date the GBPUSD always closed below the middle of the long term trend channel (green) and the middle of the short term trend channel (blue).

Why did the GBPUSD rally Friday 26th April Friday? Because the price action collided with the bottom of the long term trend channel at 1.2889.

According to the VRM theory, the collection of all FX traders in a market creates a complex system and this system has predictable short and long term trends and predictable candlestick structure.
 

Attachments

  • 2019-04-26-GBPUSD-EURGBP-EURUSD-USDCAD-1hr-1hr.png
    2019-04-26-GBPUSD-EURGBP-EURUSD-USDCAD-1hr-1hr.png
    796 KB · Views: 342
  • gbpusd.PNG
    gbpusd.PNG
    60.5 KB · Views: 356
GBPUSD, EURGBP, EURUSD & USDCAD results for 1st May 2019 - Fed Interest Rate Decision & FOMC press conference

Volatility Response Model (VRM) described in the first post of this thread.


Here are the results for the GBPUSD, EURGBP, EURUSD & USDCAD at end of day 1st May

The VRM charts below now only display the highest , lowest and S1 sentiments levels. These are the most important sentiment levels.

THREE FILES ATTACHED

FIRST FILE

Weekly VRM levels in the top 1 hour charts. Daily VRM levels in the bottom 1 hour charts. Times are GMT-3 . EMA channel (4,7) included.

EURUSD rallied to its weekly high level 1.1264 prior to the FOMC Press conference then collapsed to its highest weekly sentiment level 1.1186

GBPUSD rallied to its daily level at 1.3092 before collapsing with EURUSD on the FOMC press conference

EURGBP fell throughout the 24 hours to its daily level 0.8578

USDCAD rallied from its daily sentiment level 1.3378 to its daily level 1.3466

SECOND AND THIRD FILES

Show the 10 minute charts during the main movements of the day

2019-05-01-GBPUSD-EURGBP-EURUSD-USDCAD-1hr-1hr.png

2019-05-01-GBPUSD-EURGBP-EURUSD-USDCAD-10min-10min-1308.png

2019-05-01-GBPUSD-EURGBP-EURUSD-USDCAD-10min-10min-1812.png
 
GBPUSD, EURGBP, EURUSD & USDCAD results for 3rd May 2019 - US Non-farm Payrolls

Volatility Response Model (VRM) described in the first post of this thread.


Here are the results for the GBPUSD, EURGBP, EURUSD & USDCAD at end of day 3rd May - US Non-farm Payrolls

The VRM charts below now only display the highest , lowest and S1 sentiments levels. These are the most important sentiment levels.

THREE FILES ATTACHED

FIRST FILE

Weekly VRM levels in the top 1 hour charts. Daily VRM levels in the bottom 1 hour charts. Times are GMT-3 . EMA channel (4,7) included.

Non-farm payroll figures were irrelevant today.

GBPUSD fell from its daily S1 sentiment level at 1.3043 to the middle of its short term trend channel at 1.2994 then reversed. On the non-farm payroll figures there was a short wick before GBPUSD continued upwards to its high at daily level 1.3176

EURGBP found resistance at its highest daily sentiment level at 0.8588 and fell to its low at its daily level 0.8494.

EURUSD fell to its daily level at 1.1146 before rallying to its highest daily sentiment level at 1.1199. It too had a wick downwards on the non-farm payroll news but continued its rally upwards.

USDCAD found resistance at its highest daily sentiment level at 1.3476 and fell to its low for the day at its daily level 1.3404

SECOND AND THIRD FILES

Show the 10 minute charts during the main movements of the day . The non-farm payroll news was just a blip in the scheme of things today.

2019-05-03-GBPUSD-EURGBP-EURUSD-USDCAD-1hr-1hr.png

2019-05-03-GBPUSD-EURGBP-EURUSD-USDCAD-10min-10min-1038.png

2019-05-03-GBPUSD-EURGBP-EURUSD-USDCAD-10min-10min-1800.png
 
GBPUSD, EURGBP, EURUSD & USDCAD results for 10th May 2019 - GB GDP - CA Employment change

Volatility Response Model (VRM) described in the first post of this thread.


Here are the results for the GBPUSD, EURGBP, EURUSD & USDCAD at end of day 10th May - GB GDP - CA employment change

The VRM charts below now only display the highest , lowest and S1 sentiments levels. These are the most important sentiment levels.

THREE FILES ATTACHED

FIRST FILE

Weekly VRM levels in the top 1 hour charts. Daily VRM levels in the bottom 1 hour charts. Times are GMT-3 . EMA channel (4,7) included.

GBPUSD found support at its lowest daily sentiment level 1.3006, rallied to its highest daily sentiment level at 1.3049/ weekly level 1.3049 before falling back.

EURGBP found support at its lowest daily sentiment level 0.8619 and rallied to its weekly level 0.8639

EURUSD found support at its short term trend channel middle at 1.1215 and rallied to its daily level 1.1255 before falling back

USDCAD fell rapidly from its highest weekly sentiment level 1.3481 on the CA employment change news. Falling to daily level 1.3383

SECOND FILE

Show the 10 minute charts during the main movements of the day .

THIRD FILE

Shows the 4 hour candlestick charts with EMA channel (4.7) throughout the week for the 4 FX pairs

GBPUSD was unable to break through its weekly S1 sentiment level 1.3154 and fell to its first weekly low level 1.3081. It then found support at its weekly low level 1.3049 before finally falling to its weekly low level 1.2969

EURGBP rallied from its initial Monday low at its lowest weekly sentiment level 0.8494 and rallied to its weekly high level 0.8639.

EURUSD found resistance at its weekly S1 level 1.1213 until Thursday when it broke up to the middle of its long term trend channel at 1.1251

USDCAD had resistance at its weekly H level 1.3490 throughout the week and finally broke down through the middle of its long term trend channel at 1.3424 on the CA employment change news.

2019-05-10-GBPUSD-EURGBP-EURUSD-USDCAD-1hr-1hr.png

2019-05-10-GBPUSD-EURGBP-EURUSD-USDCAD-10min-10min-1623.png

2019-05-10-GBPUSD-EURGBP-EURUSD-USDCAD-4hr-week.png
 
GBPUSD, EURGBP, EURUSD & USDCAD results for 17th May 2019 - EUR CPI

Volatility Response Model (VRM) described in the first post of this thread.


Here are the results for the GBPUSD, EURGBP, EURUSD & USDCAD at end of day 17th May - EUR CPI

The VRM charts below now only display the highest , lowest and S1 sentiments levels. These are the most important sentiment levels.

THREE FILES ATTACHED

FIRST FILE

Weekly VRM levels in the top 1 hour charts. Daily VRM levels in the bottom 1 hour charts. Times are GMT-3 . EMA channel (4,7) included.

GBPUSD continued its decline reaching its daily low about daily level 1.2710

EURGBP continued its rally reaching its daily high at weekly level 0.8777

EURUSD continued its week's decline finally reaching weekly level 1.1160

USDCAD fell from its week's high at 1.3505 down to the middle of its long term trend channel at 1.3436

SECOND FILE

Show the 10 minute charts during the main movements of the day .

THIRD FILE

Shows the 4 hour candlestick charts with EMA channel (4.7) throughout the week for the 4 FX pairs

GBPUSD on Monday was unable to break up through its weekly S1 sentiment level at 1.3022 and fell for the rest of the week. It spent at least 16 hours at weekly level 1.2905 before continuing its fall. It then spent at least 16 hours at the bottom of its long term trend channel at 1.2844 before continuing its fall.

EURGBP rallied throughout the week. It spent at least 20 hours breaking up through the weekly 0.8745 level before reaching its high for the week at level 0.8777

EURUSD was unable to break up through the middle of its long term trend channel at 1.1239 and fell for the rest of the week to its weekly level 1.1160

USDCAD made three attempts to break through weekly level 1.3481. Its midweek fall on 16 May bounced off a daily level at 1.3398

2019-05-17-GBPUSD-EURGBP-EURUSD-USDCAD-1hr-1hr.png

2019-05-17-GBPUSD-EURGBP-EURUSD-USDCAD-10min-10min-1756.png

2019-05-17-GBPUSD-EURGBP-EURUSD-USDCAD-4hr.png
 
GBPUSD, EURGBP, EURUSD & USDCAD results for 24th May 2019

Volatility Response Model (VRM) described in the first post of this thread.


Here are the results for the GBPUSD, EURGBP, EURUSD & USDCAD at end of day 24th May

The VRM charts below now only display the highest , lowest and S1 sentiments levels. These are the most important sentiment levels.

THREE FILES ATTACHED

FIRST FILE

Weekly VRM levels in the top 1 hour charts. Daily VRM levels in the bottom 1 hour charts. Times are GMT-3 . EMA channel (4,7) included.

GBPUSD continued its rally from its weekly low to its daily high level 1.2714 then retraced to its daily S1 sentiment level 1.2670 before rallying to its highest daily sentiment level 1.2737

EURGBP fell to its daily level 0.8801 as GBPUSD rallied. EURGBP then rallied to the top of its long term trend channel at 0.8847 and fell for the rest of the day

EURUSD continued its rally from Thursday but took at least 5 hours to break through the middle of its short term trend channel at 1.1191 before making its high at daily level 1.1211

USDCAD broke through its daily S1 sentiment level 1.3469 in the 3:00 am hour, found some support at the middle of its short term trend channel at 1.3444 then finally fell to its daily level 1.3431

SECOND FILE

Show the 30 minute charts during the main movements of the day.

THIRD FILE

Shows the 4 hour candlestick charts with EMA channel (4.7) throughout the week for the 4 FX pairs

GBPUSD on Monday was unable to break up through its weekly S1 sentiment level at 1.2744 and fell until the announcement of the new Brexit bill on Tuesday. It then rapidly rose to the bottom of its long term trend channel at 1.2807. Then proceeded to fall back. Its weekly low on Thursday was at its daily level 1.2605.

EURGBP fell in response to the Brexit bill announcement then rallied to the top of its long term trend channel at 0.8847

EURUSD tried twice to break up through its weekly S1 sentiment level at 1.1180 before making its low on Thursday at its daily level 1.1124. It then rallied to finally break up through its weekly S1 level at 1.1180

USDCAD fell to its low at weekly level 1.3365 before rallying to its weekly sentiment level 1.3488. Then fell back to the middle of its long term trend channel at 1.3439.

2019-05-24-GBPUSD-EURGBP-EURUSD-USDCAD-1hr-1hr.png

2019-05-24-GBPUSD-EURGBP-EURUSD-USDCAD-30min-30min.png

2019-05-24-GBPUSD-EURGBP-EURUSD-USDCAD-4hr.png
 
GBPUSD, EURGBP, EURUSD & USDCAD results for 31st May 2019

Volatility Response Model (VRM) described in the first post of this thread.


Here are the results for the GBPUSD, EURGBP, EURUSD & USDCAD at end of day 31st May

The VRM charts below now only display the highest , lowest and S1 sentiments levels. These are the most important sentiment levels.

THREE FILES ATTACHED

FIRST FILE

Weekly VRM levels in the top 1 hour charts. Daily VRM levels in the bottom 1 hour charts. Times are GMT-3 . EMA channel (4,7) included.

GBPUSD fell to its low at daily level 1.2560 then rallied to its high at daily S1 sentiment level 1.2631

EURGBP rallied from its daily S1 sentiment level 0.8826 to its high at daily level 0.8875

EURUSD rallied from its weekly level 1.1127 to its high at daily level 1.1173

USDCAD rallied from its daily S1 sentiment level 1.3495 to its weekly level 1.3561

SECOND FILE

Show the 30 minute charts during the main movements of the day.

THIRD FILE

Shows the 4 hour candlestick charts with EMA channel (4.7) throughout the week for the 4 FX pairs

GBPUSD fell from its high Monday to weekly level 1.2626 where it found support for at least 24 hours before falling again to 1.2590. Before finally falling through all weekly VRM levels.

EURGBP rose from its weekly S1 sentiment level 0.8798 to the top of its long term trend channel at 0.8865

EURUSD fell from its lowest weekly sentiment level 1.1215 down to its weekly level 1.1127

USDCAD finally broke through the middle of its long term trend channel at 1.3452 after at least 20 hours and then rallied to its weekly high level at 1.3561. In between it fell back to its highest weekly sentiment level at 1.3495 where it found support for at least 12 hours.

2019-05-31-GBPUSD-EURGBP-EURUSD-USDCAD-1hr-1hr.png

2019-05-31-GBPUSD-EURGBP-EURUSD-USDCAD-30min-30min.png

2019-05-31-GBPUSD-EURGBP-EURUSD-USDCAD-4hr.png
 
Thanks, have you tried to trade any of your signals? What is the winning ratio?

I have been developing the VRM trading signals for about 3 years using triplets as explained in the first post of this thread. Over the last year I have been trading part time as I have other work. Using 4 hour candlesticks and 30 minute candlesticks and an EMA(4,7) channel provides the best view of the FX markets as they move about the daily and weekly VRM levels. I am now averaging about 80% winning trades using these candlesticks and the VRM levels.

As an example of the VRM levels, I attach the results for the GBPUSD, EURGBP, EURUSD & USDCAD at end of day today 5th June

The VRM charts below now only display the highest , lowest and S1 sentiments levels. These are the most important sentiment levels.

Weekly VRM levels in the top 4 hour charts. Daily VRM levels in the bottom 30 minute charts. Times are GMT-3 . EMA channel (4,7) included.

You can see the following:

GBPUSD rallied from Sunday's open to the bottom of its long term trend channel at 1.2724. Then fell with EURUSD today.

EURUSD rallied from Sunday's open then spent 32 hours trying to break through its weekly level 1.1265 before falling today.

EURGBP rallied this week to the top of its long term trend channel 0.8886 before falling

USDCAD has been falling since market open Sunday. And finally rallied today from its lowest daily sentiment level 1.3368

2019-06-04-GBPUSD-EURGBP-EURUSD-USDCAD-4hr-30min.png
 
GBPUSD, EURGBP, EURUSD & USDCAD results for 6th June 2019 - ECB Interest Rate Decision (June)

Volatility Response Model (VRM) described in the first post of this thread.


Here are the results for the GBPUSD, EURGBP, EURUSD & USDCAD at end of day 6th June - ECB Interest Rate Decision (June)

The VRM charts below now only display the highest , lowest and S1 sentiments levels. These are the most important sentiment levels.

Weekly VRM levels in the top 30 minute charts. Daily VRM levels in the bottom 30 minute charts. Times are GMT-3 . EMA channel (4,7) included.

On the announcement of the ECB rate decision EURUSD fell to daily VRM level 1.1198. I have 1.11982 as today's low.
EURUSD then rallied to daily level 1.1271 before cascading up two more daily VRM levels to level 1.1298

EURGBP fell to its daily sentiment level 0.8826 then rallied to the top of its long term trend channel at 0.8886. I have 0.8826 as today's EURGBP low.

GBPUSD moved trapped between the bottom of its long term trend channel 1.2724 and its weekly sentiment level 1.2686.

USDCAD gave the sell USD signal when it fell below its daily S1 sentiment level at 1.3408. Then continued to fall to its daily level 1.3370.
 

Attachments

  • 2019-06-06-GBPUSD-EURGBP-EURUSD-USDCAD-30min-30min.png
    2019-06-06-GBPUSD-EURGBP-EURUSD-USDCAD-30min-30min.png
    681.3 KB · Views: 316
GBPUSD, EURGBP, EURUSD & USDCAD results for 7th June 2019 - US Non farm payrolls

Volatility Response Model (VRM) described in the first post of this thread.


Here are the results for the GBPUSD, EURGBP, EURUSD & USDCAD at end of day 7th June - US Non farm payrolls

The VRM charts below now only display the highest , lowest and S1 sentiments levels. These are the most important sentiment levels.

THREE FILES ATTACHED

FIRST FILE

Weekly VRM levels in the top 1 hour charts. Daily VRM levels in the bottom 1 hour charts. Times are GMT-3 . EMA channel (4,7) included.

GBPUSD Found support at the weekly sentiment level 1.2686 Thursday and rallied to daily level 1.2759 on the NFP news

EURGBP Fell to its daily level 0.8849 and rallied on the NFP news

EURUSD Fell to its lowest daily sentiment level 1.1262 then started its rally two hours before. Rallied to its weekly level 1.1343 on the NFP news

USDCAD Continued its fall of the week. Unable to break up through its highest daily sentiment level 1.3366 and fell on the NFP news

SECOND FILE

Show the 30 minute charts during the main movements of the day.

THIRD FILE

Shows the 4 hour candlestick charts with EMA channel (4.7) throughout the week for the 4 FX pairs

GBPUSD Broke up through its weekly S1 sentiment level on Monday at 1.2654 and tried to break through the bottom of its long term trend channel at 1.2724. Found support at its weekly sentiment level 1.2686 and rallied on the NFP news

EURGBP Tried twice to break through the top of its long term trend channel 0.8886 and failed. Then finally broke through on the NFP news

EURUSD Broke up through its weekly S1 sentiment level 1.1188 on Monday. Found days of resistance at weekly level 1.1265. Then broke through to weekly level 1.1343 on the NFP news.

USDCAD Bearish all week except while trapped between the weekly levels 1.3384 and 1.3418
 

Attachments

  • 2019-06-07-GBPUSD-EURGBP-EURUSD-USDCAD-1hr-1hr.png
    2019-06-07-GBPUSD-EURGBP-EURUSD-USDCAD-1hr-1hr.png
    654 KB · Views: 339
  • 2019-06-07-GBPUSD-EURGBP-EURUSD-USDCAD-30min-30min.png
    2019-06-07-GBPUSD-EURGBP-EURUSD-USDCAD-30min-30min.png
    856.4 KB · Views: 310
  • 2019-06-07-GBPUSD-EURGBP-EURUSD-USDCAD-4hr.png
    2019-06-07-GBPUSD-EURGBP-EURUSD-USDCAD-4hr.png
    429.2 KB · Views: 335
GBPUSD, EURGBP, EURUSD & USDCAD results for 12th June 2019

Volatility Response Model (VRM) described in the first post of this thread.


Here are the results for the GBPUSD, EURGBP, EURUSD & USDCAD at end of day 12th June.

The VRM charts below now only display the highest , lowest and S1 sentiments levels. These are the most important sentiment levels.

Weekly VRM levels in the top 30 minute charts. Daily VRM levels in the bottom 30 minute charts. Times are GMT-3 . EMA channel (4,7) included.

GBPUSD rose to daily sentiment level 1.2754. Unable to break through weekly S1 sentiment level 1.2750 or the middle of its short term trend channel 1.2740. Then fell to its daily level 1.2681.

EURGBP unable to break through the top of its long term trend channel at 0.8909 and fell to its daily level 0.8872.

EURUSD rose to its daily sentiment level 1.1343 then fell to its daily level 1.1291.

USDCAD had support on the bottom of its long term trend channel at 1.3281. Tested this level before rising to its weekly sentiment level 1.3351

Plenty of large gaps between VRM levels to trade.

2019-06-12-GBPUSD-EURGBP-EURUSD-USDCAD-30min-30min.png
 
GBPUSD, EURGBP, EURUSD & USDCAD results for 14th June 2019

Volatility Response Model (VRM) described in the first post of this thread.


Here are the results for the GBPUSD, EURGBP, EURUSD & USDCAD at end of day 14th June

The VRM charts below now only display the highest , lowest and S1 sentiments levels. These are the most important sentiment levels.

THREE FILES ATTACHED

FIRST FILE

Weekly VRM levels in the top 1 hour charts. Daily VRM levels in the bottom 1 hour charts. Times are GMT-3 . EMA channel (4,7) included.

A buy US$ day

GBPUSD Unable to break up through the bottom of the long term trend channel at 1.2679 and fell through the day to weekly level 1.2591

EURGBP tried again to break through the top of its long term trend channel at 0.8909 and failed

EURUSD tried to break up through its daily S1 sentiment level 1.1284 and failed. Then fell to its daily level 1.1206

USDCAD found support on its highest daily sentiment level 1.3335 and rose to its daily level 1.3418

SECOND FILE

Show the 30 minute charts during the main movements of the day.

THIRD FILE

Shows the 4 hour candlestick charts with EMA channel (4.7) throughout the week for the 4 FX pairs

GBPUSD found support on its weekly level 1.2670 and then tried to break up through its weekly S1 sentiment level 1.2750 and failed. Fell back to weekly level 1.2670 and found support there for at least 16 hours before falling to weekly level 1.2591

EURGBP succeeded in breaking through the top of its long term trend channel 0.8909 on 11th June but fell as GBPUSD rallied from its weekly level 1.2670. Then tried twice more to break up through 0.8909 and failed

EURUSD tried to break up through its weekly S1 sentiment level at 1.1330 and failed. Then fell the rest of the week to weekly level 1.1201

USDCAD broke up through the bottom of its long term trend channel at 1.3281 and found support there. Then rallied to its highest weekly sentiment level 1.3351. Then fell back. Finally rallying to its weekly level 1.3410

2019-06-14-GBPUSD-EURGBP-EURUSD-USDCAD-1hr-1hr.png

2019-06-14-GBPUSD-EURGBP-EURUSD-USDCAD-30min-30min.png

2019-06-14-GBPUSD-EURGBP-EURUSD-USDCAD-4hr.png
 
GBPUSD, EURGBP, EURUSD & USDCAD results for 19th June 2019 - Fed Interest Rate Decision & CA core CPI

Volatility Response Model (VRM) described in the first post of this thread.


Here are the results for the GBPUSD, EURGBP, EURUSD & USDCAD at end of day 19th June.

The VRM charts below now only display the highest , lowest and S1 sentiments levels. These are the most important sentiment levels.

Weekly VRM levels in the top 30 minute charts. Daily VRM levels in the bottom 30 minute charts. Times are GMT-3 . EMA channel (4,7) included.

EURGBP found resistance at its daily S1 sentiment level 0.8918 and fell for the rest of the day to the middle of its short term trend channel at 0.8878

GBPUSD followed EURGBP at 4 am (GMT-3) and bought GBPUSD. Rose through the day and continued rising after the FED decision. High for the day at daily level 1.2668

EURUSD found support at its lowest daily sentiment level 1.1190 and rose from there. Continued to rise on the FED decision to its high at its highest weekly sentiment level 1.1247

USDCAD had support for at least 7 hours on its daily S1 sentiment level 1.3375. Then fell on the CA core CPI numbers to its lowest daily sentiment level 1.3349. Finally fell on the FED decision to daily level 1.3284.

Plenty of large gaps between VRM levels to trade.
 

Attachments

  • 2019-06-19-GBPUSD-EURGBP-EURUSD-USDCAD-30min-30min.png
    2019-06-19-GBPUSD-EURGBP-EURUSD-USDCAD-30min-30min.png
    728.2 KB · Views: 287
Top