GBPUSD trade 10th May - BoE Interest Rate Decision
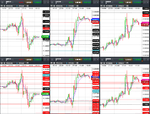
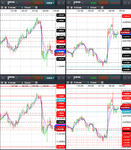
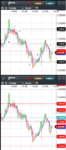
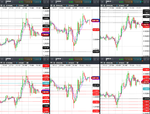
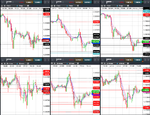
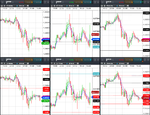
I attach the weekly VRM levels in the top 5 minute charts, daily VRM levels in the bottom 5 minute charts. Times are GMT-4 . EMA channel (4,7) included.
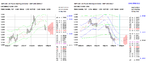
Prior to the BoE Interest Rate Decision the GBPUSD bounced down off daily level 1.3608 and weekly sentiment level 1.3609. EURGBP had also bounced up off its long term trend channel middle at 0.8729 and had support on its weekly sentiment level 0.8736. All signals indicated sell GBP.
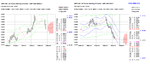
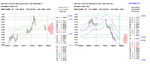
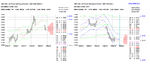
I attach my GBPUSD sell trade prior to the BoE Interest Rate Decision and its close just above weekly sentiment level 1.3510 where support started. 88.1 basis points profit.
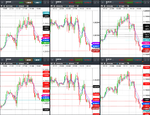
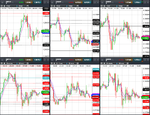
I attach the weekly VRM levels in the top 5 minute charts, daily VRM levels in the bottom 5 minute charts. Times are GMT-4 . EMA channel (4,7) included.
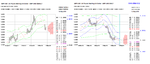
Prior to the BoE Interest Rate Decision the GBPUSD bounced down off daily level 1.3608 and weekly sentiment level 1.3609. EURGBP had also bounced up off its long term trend channel middle at 0.8729 and had support on its weekly sentiment level 0.8736. All signals indicated sell GBP.
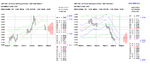
I attach my GBPUSD sell trade prior to the BoE Interest Rate Decision and its close just above weekly sentiment level 1.3510 where support started. 88.1 basis points profit.